"Using the new clock, she would be a mere 6000 years old. No one thinks that's the case, but at what point should models switch from one mtDNA time zone to the other?" — Ann Gibbons, Science, 2 January 19981
"Ten substitutions were observed, resulting in an empirical rate of 1/33 generations, or 2.5/site/Myr. This is roughly twenty-fold higher than estimates derived from phylogenetic analyses." — Thomas Parsons and colleagues, Nature Genetics, 19972
"The reported 'genealogical' mtDNA mutation rates are a bit too slow for the creationists." — Robert Carter, Creation Ministries International, 20253
Summary
Every person alive inherits their mitochondrial DNA from their mother alone. Follow those maternal lines back far enough and they converge on one woman. She is called mitochondrial Eve.
That much is not controversial. What is controversial is when she lived. The standard answer is roughly 150,000 years ago. A young-earth answer would need her within about 6,000 years, and there is a real, published, measured discrepancy that seems to deliver exactly that. Counting mutations by comparing mothers with their children gives a rate ten to twenty times faster than comparing populations. Run the fast rate backwards and Eve lands a few thousand years ago instead of a few hundred thousand. A 1997 paper in Nature Genetics said so in print. Science put it on its news pages a year later.
This article works the numbers and finds that the argument fails: for a reason almost nobody on either side states clearly, and short of a number that is not the number most people expect.
A new mutation in mitochondrial DNA does not arrive as a clean swap. Each of your cells carries hundreds to thousands of separate mitochondrial genomes, so a new mutation starts as a minority variant among many copies, a state called heteroplasmy, and the overwhelming majority of those variants are lost within a generation or two. The fast pedigree rate counts mutations appearing. The slow phylogenetic rate counts mutations staying. These are different quantities, the gap between them has been measured directly, and it is enormous: in the largest single study, 477 new variants appeared across 1,526 mother-child transmissions while only about three came anywhere near taking over.4 The young-earth calculation takes the appearing rate and uses it as the staying rate.
That invites the obvious suspicion, is the rate simply declared to change whenever a long stretch of time needs explaining?, and it gets its own section below. Most of the gap is not a rate difference at all, but two quantities sharing one name. There is a genuine time-dependent component, caused by ongoing purifying selection, and it is about twofold. The whole account has been checked in a species whose history is independently known. A 6,000-year Eve needs the long-term rate multiplied by about 27, measured against Rieux's ancient-DNA rate, or by about 23 after the full accounting below grants every correction.
The one measurement that decides it
Everything else in this article is context for a single test, and the test needs no radiometric dating, no chimpanzee, and no assumption about deep time.
If mutations really do become permanent at the fast rate, then a family tree deep enough to watch should show them becoming permanent. In 2022 a team led by Jennifer Connell sequenced the entire mitochondrial genome across 45 maternal lineages on Norfolk Island: 345 mother-child transmissions in a documented genealogy.5 Nathaniel Jeanson's published young-earth rate predicts 54.6 permanent changes in that many transmissions. The study found two.
That is not a near miss. Under Jeanson's rate the probability of seeing two or fewer is about 3 in 1021. That probability is conditional on the usual counting model: each change independent, each fully detectable, at a constant rate. The way Connell's team counted transmissions can hide at most about 15% of changes, as the test below shows. And it is a pedigree study checked against a pedigree prediction, so the usual young-earth objections do not reach it: nothing here is calibrated on an ape divergence, and nothing depends on radiocarbon.
Connell's own abstract calls the team's rate "approximately 16 times higher" than phylogenetic estimates. That sentence describes their all-inclusive count, which takes in heteroplasmies and somatic mutations, and the section below traces where the 16 came from. The rate the same team measured for permanent changes alone was 1.30 × 10⁻⁸ per site per year. The phylogenetic rate the entire young-earth argument exists to overturn is 1.665 × 10-8.6 Those two agree.
What the young-earth case gets right
Several parts of it are correct, and one has been badly handled by critics.
- The discrepancy is real and it is mainstream. It was not invented by creationists. It was measured, published in Nature Genetics, front-paged by Science, and it changed FBI forensic practice.1 7 Luisa Madrigal's team wrote in 2012 that "until the cause of these discrepancies will be fully understood," both the fast and slow estimates "should be considered."8
- The circularity charge is half right. The classic 150,000–200,000 year figures are derived by assuming a human-chimpanzee split date. Ingman's 2000 paper says so in as many words.9 A young-earth reader who denies that common ancestor is entitled to say those numbers are worthless to him. He is not entitled to say it about the newer ancient-DNA estimates, which use no ape calibration at all, and those land in the same place.
- Robert Carter is right about one thing his critics get wrong. Under neutral theory the long-run substitution rate equals the mutation rate regardless of population size.10 Critics who answer creationists by saying "selection always slows the clock down" are stating something false about neutral sites. The real answer is different and is given below.
- Human lineages do not all tick at one speed, and this article previously said the spread was capped at twofold. Refitting its own 229 ancient genomes rejects exact rate homogeneity among four subclades of a single haplogroup, at about threefold. The result is fragile, but the flat two-fold ceiling was not supportable and has been corrected below.
- A single-locus date is not a precision instrument. Even taking the standard model at face value, the 95% spread on a coalescent time to a most recent common ancestor is roughly sevenfold. Confident recitations of "200,000 years ago" overstate what one gene can tell you.
And what it gets wrong
- The 6,500-year figure rests on the fastest single study, and pooling the rest breaks it. Parsons 1997 measured the control region and computed ~6,500 years from his own rate. Howell pooled nine such studies in 2003, Parsons' data among them, and got a rate 2.6 times slower. Run backwards on 54 human control regions, that pooled rate dates Eve to about 15,000 years, or 31,700 at the deepest split, not 6,000.
- The most-quoted sentence in the creationist literature is usually cut off mid-thought. Science's "she would be a mere 6000 years old" is followed, in the next paragraph, by "No one thinks that's the case." Most creationist citations stop before it. Some do not: the Institute for Creation Research's own Brian Thomas prints the full passage.11 Both facts are documented below with the text side by side.
- A young-earth author has made the same unit error for eighteen years. Carter converts control-region mutation rates into whole-genome rates by multiplying the per-site rate across all 16,569 sites, when the measurement covered about 1,122. His doubling for the rest of the molecule is sound, since about half of all mutations do fall outside the control region, but after the 16,569-site multiplier it counts the same bases twice. And the rate he starts from is a divergence rate, twice the mutation rate, which should have been halved. The 16,569-site multiplier and the unhalved divergence rate inflate his headline figure roughly thirtyfold, and the result contradicts numbers he prints three paragraphs later in the same article.
- The Ark does not predict a three-way root, but the Flood model still fails a branch-length test. Eight people were on the Ark, so at most three maternal lines crossed it. That does not require a three-way split at the root of the human mtDNA tree, because the three wives' lines all go back to Eve and can part from one another in two steps. The root is a two-way split, which refutes Jeanson's 2016 reading of three nodes as three wives, not the three wives themselves; Carter allows "1, 2, or 3" lines. What fails is the arithmetic: founders placed at the deepest nodes need 10, 13 and 14 mutations in the 1,656 years before the Flood, and measured rates supply 0.5 to 3.9.
The honest number
Take the largest direct measurement ever made, deCODE's 116,663 mother-child transmissions in Iceland, 8,199 mutations12, and divide the measured depth of the human mitochondrial tree by it. Taken raw, it gives roughly 24,000 years at deCODE's own measured generation of 29.3 years, or about 20,300 at the 25 years this article uses for every other study.
That suits nobody. It is four times too old for a young earth and six times too young for the standard timeline. It is what you get when you push a short-term measurement out past the range it was measured over, which is exactly what both sides are doing.
And it is not even one number. Taken raw, the 8,199 mutations give about 24,000 years. Two sensitivity checks run in this article, which convert the same count of variants detected at 5% of sequencing reads into a rate of permanent change with published formulas, give about 61,000 and about 360,000 years. Those two are not results anyone published. They show that the conversion alone moves the answer fifteenfold with no new data in it at all. The conversion, not the counting, is where this dispute actually lives. The article ends there rather than pretending otherwise.
The newest measurement makes the point better than any argument could. In 2025 a team sequenced mitochondrial DNA inside 80 single human eggs, accurately enough to catch variants present in one copy in a million. Counted as a clock, which the authors did not do and this article does only to show the scale, the rate they measured dates Eve to about 1,900 years, too young for the young-earth answer, never mind the standard one. Nobody will defend that as a date. Most of the egg study's speed is its detection threshold: counted at the same 5% cutoff deCODE used, its coding-region rate falls to 2.50 × 10⁻⁶ per site per generation against deCODE's 2.87 × 10⁻⁶. Working out why the more sensitive instrument always finds the faster rate is the whole of this article.
What a young date would need
A 6,000-year Eve is not ruled out by any law of nature. It is ruled out by the rates measured so far. To get there, a young-earth model needs one of three things, and each has to reproduce the whole tree, the ancient genomes and the family counts at once: variation already present in Eve's own mitochondria at creation, which no measurement refutes and none has tested; a burst of retained mutations in the centuries after the Flood, running about a hundred to three hundred times today's retained rate while the lineages were splitting; or a measured mutator, such as a defective copying enzyme, strong enough in the germline to do the same. The best new lead is the third: in mice, a mitochondrial polymerase that cannot proofread makes enough lasting changes in the germline to produce the whole depth of the human tree in about 200 to 600 years, though nothing shows such a burst ever happened in humans. What would make a young history work? prices each of them.
What mitochondrial Eve is — and four things she is not
Mitochondria are the small structures inside your cells that turn food into usable energy. They carry their own tiny genome, 16,569 base pairs long, quite separate from the 3.2 billion in the cell nucleus. Sperm mitochondria are destroyed after fertilisation, so you get yours from your mother, she got hers from her mother, and so on back.
Because there is no shuffling and no father's copy to mix with, every human mitochondrial genome traces one unbroken female line. Draw all those lines and they must eventually meet. The woman where they meet is mitochondrial Eve.
She was not the only woman alive. This is the most common misunderstanding, and fewer people hold it than you would think. The word "Eve" appears nowhere in the 1987 paper that started this.13 It came from the press. Allan Wilson, one of the paper's three authors, complained about it in Newsweek at the time:
"There must be one lucky mother," Wilson says. "I worry about the term 'Eve' a little bit because of the implication that in her generation there were only two people. We are not saying that. We're saying that in her generation there was some unknown number of men and women, probably a fairly large number, maybe a few thousand."14
Creation Ministries International's own flagship article on the subject says the same thing, correctly:
"Evolutionists do not claim, nor can it be fairly stated, that this evidence proves that there was only one woman alive at any point in the past. ... The mitochondrial Eve data does not force the belief that there was only one woman from whom we all descended — in other words, it doesn't prove the Bible — but — a very important 'but' — it is most definitely consistent with it."15
That is an accurate statement of the mathematics, and the movement deserves credit for it. Do not accuse creationists in general of this error.
She was not a surprise. This one is commonly claimed and it is false. Carter writes that researchers "had no way of predicting Eve's existence before they discovered her," and that a bottleneck was "added to the evolutionary model, post facto."3 Wieland's 1998 article says "it was not something that was expected by evolutionists."15
Three years before Cann's paper, in 1984, John Avise and colleagues published simulations of exactly this, concluding that in a stable population founded by n females, "it is highly probable that within about 4n generations all descendants will trace their ancestries to a single founder female."16 No bottleneck required. A single ancestral female for a non-recombining maternal locus is what ordinary population genetics predicts, and it was in print first. The two claims can be set beside each other and dated.
She need not be the same age as the male equivalent. Y-chromosome Adam gets his own article on this site; the short version is that the two estimates have moved around a great deal and currently overlap.
Her identity moves forward in time. If two of Eve's descendant lineages die out, the common ancestor of what remains is a later woman. Lineages go extinct constantly. The clearest demonstration runs in the opposite direction: in 2013 a single previously unsampled Y-chromosome lineage turned up in one African-American man, and the estimated age of the Y-chromosome ancestor jumped by about 200,000 years.17 A single-locus most recent common ancestor is a property of the sample as much as of history.
What survived 1987, and what did not
Both sides misdescribe the founding paper.
Rebecca Cann, Mark Stoneking and Allan Wilson analysed mitochondrial DNA from 147 people and concluded the common ancestor lived about 200,000 years ago, probably in Africa.13 They did not sequence anything, because sequencing whole genomes was not feasible in 1987. They cut the DNA with twelve restriction enzymes and inferred divergence from the pattern of cut sites. They found 467 sites, 195 of them variable, and surveyed an average of 370 per person, covering "about 9%" of the genome.13 The entire statistical case for an African root rested on 93 informative sites and a single comparison between their preferred tree and one alternative, which they won by a score of 22 to 4.13
They also disclosed their own worst problem. Of the 20 Africans in the sample, only two were born in sub-Saharan Africa; the other 18 were Black Americans.13
Between 1991 and 1992, David Maddison, Alan Templeton and a team led by Blair Hedges showed that the "minimum-length" tree was not minimum-length, that many equally good trees had non-African roots, and that the 22:4 test collapsed with them. Science ran a news item titled "'African Eve' backers beat a retreat."18 Martin Richards and Vincent Macaulay summarised the failure mode a decade later: because some control-region sites mutate very fast and repeatedly, "many tree topologies are equally plausible," and parsimony has no grounds for choosing.19
What did not survive: the specific 1987 tree, the 22:4 test, and the claim that restriction-site parsimony had demonstrated an African root.
What did survive: that a single mitochondrial ancestor exists, that the root is recent compared to the Homo fossil record, and that African mitochondrial diversity is the highest in the world. Those were measured directly and never depended on the tree. The African root was re-established later on different evidence: whole-genome sequencing, beginning with Ingman in 2000.9
This history matters for a reason that cuts against the creationist use of it. It shows the field correcting a flagship result under criticism, in public, within five years. It is not evidence that the current result is equally shaky; it is evidence about how the current result got tested.
The young-earth case, stated at its strongest
Nobody should have to read the young-earth case through a critic. What follows is built from its own sources, in the strongest form the numbers permit.
Step one: the clock has two settings, and they disagree. Compare human DNA to chimpanzee DNA, divide by an assumed five million years, and you get a mitochondrial mutation rate around 1.7 × 10⁻⁸ per site per year.9 Sequence mothers and their children directly and you get something far faster. Thomas Parsons and colleagues sequenced 610 base pairs of the fast-evolving control region across 327 mother-child transmissions in 1997 and observed ten changes where the phylogenetic rate predicted less than one.2 In their abstract's words, "Ten substitutions were observed, resulting in an empirical rate of 1/33 generations, or 2.5/site/Myr. This is roughly twenty-fold higher than estimates derived from phylogenetic analyses."2
Step two: run the fast clock backwards. Parsons did the arithmetic himself. Calibrated with his team's rate, the paper says, the clock would put the most recent common maternal ancestor only about 6,500 years ago, an age the authors called clearly incompatible with the known age of modern humans.2
Step three: check it on the whole genome. Parsons measured only the control region, which is unusual DNA. Jeanson pooled three whole-genome parent-child studies, 398 transmissions, 63 mutations, and got 9.55 × 10⁻⁶ per base pair per generation, or 0.158 mutations across the whole molecule per generation.20 Multiply by 6,000 years at a 25-year generation and you predict about 38 differences between two people. The observed average is 39 to 40.21
That is the argument. It is quantitative, it cites mainstream sources for every input, and its arithmetic is clean. Working through Jeanson's spreadsheets, he publishes them, with the formulas intact, every figure in his Table 1 reproduces exactly. There is no computational error to expose.
Step four, which is the part usually left out. Even taken entirely at face value, this does not deliver 6,000 years. Anchoring on the maximum observed difference between any two humans (123 changes, the most robust anchor available) and using Jeanson's own preferred equation gives a range from about 4,700 to 18,100 years depending on generation time and where in the confidence interval you sit. The central value, his point estimate at a 25-year generation, is 9,713 years.
Six thousand years is reachable only at the corner of that space, with fifteen-year generations and the top of the confidence interval. Jeanson's 2016 paper argues for exactly those fifteen-year generations, and that argument is where his case is weakest; the newest data run the other way, and the section on arithmetic errors below gives the numbers.
Which distance is being dated?
A clock divides a distance by a rate, and the two must be measured the same way. Getting the distance wrong costs a factor of two before any biology enters.
For one branch, running from an ancestor down to one living person, the constant-rate calculation is:
years = changes along the branch / changes per yearFor two living people who descend from the same ancestor, changes pile up along both branches:
years = pairwise differences / (2 x changes per year)In symbols, a root-to-tip distance is b = μg and a pairwise difference is d = 2μg, where μ is the rate per genome per generation and g is the number of generations since the shared ancestor. The second equation assumes the two branches ran at the same average rate. Both need more work when a site mutates twice and hides the first change, when selection decides which variants survive, or when some variation was already present at the start.
An average pairwise difference is not the depth of the whole tree. Most pairs of living people share an ancestor much more recent than mitochondrial Eve. Half the average pairwise distance therefore understates the distance from Eve to a living person. The maximum pairwise distance depends on who happened to be sampled, and it is not a reconstruction of the tree either.
The two published summaries come from different samples and measure different things. Kim and Schuster's 7,098 genomes had a mean pairwise difference of 39.8 and a maximum of 123.21 Doron Behar's team reconstructed the tree from 18,843 genomes and reported a mean root-to-tip depth of 57.1 substitutions, with values from 41 to 77. The paper's separate figure of 8,216 counts the genomes added to refine the tree, not the genomes the 57.1 is averaged over.22 Neither number can stand in for the other without saying so.
This article uses Behar's 57.1 as the common yardstick. Six thousand years at 25 years a generation is 240 generations, so a history that starts from a single mitochondrial sequence needs 0.238 retained changes per genome per generation. A 10,000-year history needs 0.143. Moving the starting point to the Flood raises the requirement, unless the variation was already there when the Flood ended.23 That 0.238 is what the young-earth model requires. It is not a measured mutation rate, and it assumes that every one of the 57.1 changes arose after Eve.
Jeanson's whole-genome calculation
Read with the matching distance, Jeanson's own rate gives about 9,000 to 9,700 years, not 6,000.
Nathaniel Jeanson's 2015 analysis pooled 398 transmissions from three studies and counted 63 differences, for 0.158 changes per genome per generation. Almost all the weight came from one study, Ding and colleagues' Sardinian data.24 20 At 25 years a generation that rate produces 37.9 changes along one lineage in 6,000 years. Two people whose shared ancestor lived 6,000 years ago would differ by 75.8, because both branches collect changes. So comparing the one-branch prediction of 38 with the average pairwise difference of 39.8, as step three does, leaves out half the expected changes.23
Done with matching distances, Jeanson's rate puts Behar's 57.1 root-to-tip changes at about 9,000 years, and Kim and Schuster's maximum pairwise difference of 123 at about 9,700. Across generation lengths and the rate's confidence limits the range is roughly 4,700 to 18,100 years, as step four says. Six thousand is one corner of that range, not its center.20 25
Jeanson saw the next problem himself. Ding's study measured how well mitochondrial calls agreed between relatives. It did not show that every disagreement was a new inherited mutation, and Jeanson wrote that "the DNA sequences from at least three successive generations must be sequenced" to rule out mutations in non-reproductive cells.20 Of the 63 differences, 35 are gains and 28 are losses, and the losses fail a simple test of their own, set out in Where the 63 came from below.
The same check, run on the control-region side
Step four applies to Parsons too, and almost nobody runs it. His 6,500 years comes from the single fastest measurement in the literature. Pool the measurements and the answer moves a long way.
Neil Howell's team pooled nine control-region pedigree studies in 2003, Parsons' own data among them, into 28 mutations across 2,633 transmissions. Their rate was 0.95 mutations per base pair per million years, with a 99.5% confidence interval of 0.53 to 1.57.26 That is 2.6 times slower than Parsons' 2.5.
Howell's headline was the gap, not a date. The pooled pedigree rate is "∼10 times higher than the phylogenetically derived divergence rates for this region," which he sets against Stoneking's 0.118, Tamura and Nei's 0.087 and Hasegawa's 0.098: a mean of 0.101, so the ratio is 9.4. He offers no single cause: "There is no evidence that any one factor explains this discrepancy." And he never turns his rate into an age for Eve.26
So turn it into one. Take 54 modern human control regions, the revised Cambridge Reference Sequence plus Ingman's 53 globally sampled genomes, the same panel behind the standard 171,500-year figure, and measure how far apart they actually are. Two humans differ by 15.88 substitutions on average over 1,097 comparable sites, which is 1.447%. The two most distant differ by 33, which is 3.008%.27 Divide the distance by the rate:
| Rate used, mutations per bp per Myr | Age from the average pair | Age from the deepest split |
|---|---|---|
| Howell 2003 pedigree, nine studies pooled: 0.95 | 15,200 years | 31,700 years |
| the same, fast end of its interval: 1.57 | 9,200 years | 19,200 years |
| the same, slow end: 0.53 | 27,300 years | 56,800 years |
| Parsons 1997 alone: 2.50 | 5,800 years | 12,000 years |
| Stoneking 1992, phylogenetic: 0.118 | 122,600 years | 254,900 years |
| Hasegawa 1993, phylogenetic: 0.098 | 147,700 years | 307,000 years |
The pedigree rate does not deliver 6,000 years. It delivers about 15,000, or about 32,000 if the deepest split is dated rather than the average pair. Six thousand appears only when the fastest single study is used on its own. Pooling nine studies, including that one, moves the answer two and a half to five times away from it. This is the same pattern as step four above: the young-earth number survives at the edge of the evidence, not in the middle of it.
And the comparison is not clean even then. Howell's methods say exactly what his rate counted: "All newly arising substitutions, both heteroplasmic and homoplasmic, were included in our divergence-rate estimates." A phylogeny records only the changes that took over. Dividing a phylogenetic distance by an arising rate mixes two different quantities, which is the subject of the next section.
One weakness in the arithmetic above, stated plainly. Fifty-four sequences under-sample the deepest African branches, so 33 substitutions is a floor on the true maximum and the deepest-split ages are, if anything, too young. Behar's 18,843 genomes span 41 to 77 substitutions from the reconstructed root across the whole molecule.22
The quotation everyone uses
One sentence from a 1998 Science news article appears in hundreds of creationist pieces. Because so much rests on it, here is the full passage, transcribed from a verbatim reprint that AAAS licensed to Cold Spring Harbor's DNA Interactive teaching materials, checked against an independent Wayback capture.1
"Regardless of the cause, evolutionists are most concerned about the effect of a faster mutation rate. For example, researchers have calculated that 'mitochondrial Eve'--the woman whose mtDNA was ancestral to that in all living people--lived 100,000 to 200,000 years ago in Africa. Using the new clock, she would be a mere 6000 years old.
No one thinks that's the case, but at what point should models switch from one mtDNA time zone to the other?"1
The disclaimer opens a new paragraph. That is a genuine mitigating fact for anyone who quoted only the paragraph above it, and it should be said.
It is not a defence of what comes next. Russell Humphreys, writing for the Institute for Creation Research, states that these measurements "recently forced researchers to revise the age of 'mitochondrial Eve' from a theorized 200,000 years down to possibly as low as 6,000 years," citing Gibbons.28 Nothing was revised. No researcher revised anything. Gibbons says the opposite in the following sentence. That is not a truncation; it is a claim the source does not contain. A university student page caught the same error twenty-one years ago.29
To ICR's credit, its own Brian Thomas quotes the passage in full, including "No one thinks that's the case."11 Fair quotation of this source exists in the creationist literature. It is simply not the norm.
The error on the other side. The standard online rebuttal, by Alec MacAndrew, states four separate times that Parsons and Howell used RFLP analysis, and builds a conclusion on it.30 They did not. Parsons directly sequenced 610 base pairs of the two hypervariable segments. Gibbons says so explicitly in the article MacAndrew is rebutting.
And the forensics. Gibbons reports that Parsons and Holland changed their identification guidelines, "adopted by the FBI as well," so that a single-nucleotide difference between a suspect and a crime-scene sample is now reported as "inconclusive" rather than a mismatch.1 This is true and independently documented in the FBI Laboratory's own published interpretation guidelines.7 It is the most concrete real-world consequence in the whole story.
But notice what the rule is about. It is a rule for comparing two specimens for identity. It has nothing to do with the age of mitochondrial Eve. Three creationist sources state or imply that the FBI changed its guidelines because of findings pointing to a 6,000-year Eve. That is false.
The circularity charge, which is half right
Creationists have long argued that the mitochondrial clock is circular: it assumes evolution to date evolution. How much of that is true turns out to be checkable, and the answer splits cleanly in two.
The classic estimates are calibrated on the ape divergence, and openly so. Ingman's 2000 paper states the method in one sentence:
"From the mean genetic distance between all the humans and the one chimpanzee sequence (0.17 substitutions per site) and the assumption, based on palaeontological and genetic evidence, of a divergence time between humans and chimpanzees of 5 Myr, the mutation rate (μ) for the mitochondrial molecule, excluding the D-loop, is estimated to be 1.70 × 10⁻⁸ substitutions per site per year."9
Read that carefully with the measurement/model distinction in hand. The 0.17 substitutions per site is a measurement. The 5 million years is an assumption. The rate is a model output. And the 171,500-year date for Eve that Ingman derives from it is a model output twice over. It cannot be offered as independent evidence for either the age of humanity or the ape divergence, and a young-earth reader who rejects it on those grounds is reasoning correctly.
Depending on a calibration is not, by itself, circular. A clock can legitimately borrow an independently supported date. The reasoning becomes circular only when the output is then offered as proof of its own input: when Ingman's 171,500 years is cited as evidence that humans and chimpanzees split 5 million years ago. A young-earth reader who rejects the calibration has found a conditional premise, not an arithmetic mistake. And swapping one calibration for another on the same data can move the answer a long way: Endicott and Ho got about 162,000 years from an external calibration and about 108,000 from an internal one, on the same sequences.31
What is actually measured here is a ratio: the depth of the human mitochondrial tree divided by the human-chimpanzee distance, roughly 1 to 29 or 1 to 41 depending on the study. Everything else is the number of years you attach to the denominator.
The newer estimates use no ape at all. This is the part the young-earth literature has not engaged, and it is decisive. Since 2013 the rate has been measured a completely different way, called tip calibration or branch shortening. The idea is simple enough to state in a sentence: a person who died 40,000 years ago has had 40,000 fewer years to accumulate mutations than you have, so their DNA sits on a shorter branch, and counting how much shorter gives you the rate directly.
No chimpanzee. No divergence date. No assumption about the age of anything except the sample itself.
Four groups have now done this independently, and they agree:
| Study | Calibration | Rate, per site per year |
|---|---|---|
| Fu et al. 2013 | 10 radiocarbon-dated ancient genomes | 2.67 × 10⁻⁸ |
| Brotherton et al. 2013 | 39 Neolithic and Bronze Age genomes | 2.4 × 10⁻⁸ |
| Fu et al. 2014 | Ust'-Ishim femur alone | 2.53 × 10⁻⁸ |
| Rieux et al. 2014 | 26 ancient + 320 modern genomes | 2.14 × 10⁻⁸ |
| Posth et al. 2016 | 66 dated genomes | 2.74 × 10⁻⁸ |
Dropping the ape calibration moves the answer by about 20 to 25%. Not by a factor of twenty-five.
There is a further detail worth stating because it shows the tip-calibrated clock is not being tuned to agree with the fossil record. Rieux's tip-calibrated rate, applied to the human-chimpanzee comparison, returns a split at 4.14 million years, younger than the 6 to 7 million years the fossil evidence is usually taken to support.32 The two calibration systems do not agree with each other. If tip calibration were quietly reproducing the assumed answer, it would not do that.
The crux: mutations that appear versus mutations that stay
Everything turns on one distinction, and it is not a difficult one.
A cell in your body carries somewhere between a hundred and several thousand separate copies of the mitochondrial genome.24 When a mutation happens, it happens in one of those copies. The cell then contains a mixture: many original copies and one mutant. That mixed state is called heteroplasmy.
For the mutation to become permanent in a lineage, the mutant copy must take over: every copy in the descendant's cells must end up carrying it. That state is called homoplasmy. Between the two stands a severe filter. During the formation of a woman's egg cells, the number of mitochondrial genomes drops to a very small number before expanding again, the germline bottleneck, and most minority variants are simply lost at that step by chance.
So there are two different rates:
- the rate at which new variants appear (fast, easy to detect with sensitive sequencing);
- the rate at which variants become permanent (slow, and it is the only one that matters for a clock).
The team that measured the bottleneck stated the relationship as an equation. A new mutation sits in one of N bottleneck units, so "only 1/N of them will go to fixation, leading to μ = α/N," where α is the appearing rate and μ the fixing rate.33 Their measured α was 0.143 mutations per genome per generation. Their μ was 0.0045.
Jeanson's published young-earth rate is 0.158 mutations per genome per generation. That is almost exactly Rebolledo-Jaramillo's appearing rate, and the young-earth calculation uses it as the fixing rate. That single substitution is the whole argument.
What a study's count can mean
A "mutation" in a family study can be any of several different events, and only some of them belong in a clock. Homoplasmy means one version is the only one detected in the tissue sampled, above that assay's threshold. It does not prove that every copy in every cell of the person is identical, and it does not guarantee the site will never change again.
| What the study saw | What that establishes |
|---|---|
| A new low-frequency variant passes the assay's thresholds in a child's blood | A difference was detected in that tissue. Its origin, and whether it will be inherited, need checking. |
| The variant is also present in other tissues or in maternal relatives | It was inherited by an egg, child or later descendant, so a germline origin becomes more plausible. |
| An inherited variant rises from 2% to 60% | Its frequency changed. That need not be a new mutation. |
| A changed sequence is homoplasmic in sampled descendants | No other base was detected above the threshold there. This is a much stronger candidate for a lasting change in the lineage. |
| A change appears on a population tree | The sampled inherited sequences differ. That is not the same as the change becoming universal in a population. |
| A variant becomes universal in a defined population | Population fixation, which no family study observes directly. |
Two of these points help the young-earth side, and both are true. A heteroplasmy can persist and be inherited without first becoming homoplasmic. And a mutation can tell two maternal lineages apart without ever becoming fixed throughout humanity. So the rate a clock needs is not literally a rate of population fixation. It is the rate at which changes are retained along the sampled family tree, under a model that accounts for frequency, detection, transmission and selection.33 34 That is still far slower than the rate at which new variants are detected, for the reasons the rest of this section gives.
The bottleneck's "effective size" measures how much random sampling would reproduce the frequency shifts seen between mother and child. It need not equal a literal count of mitochondrial molecules in an egg.
The gap, seen in one dataset
This is not a theoretical worry. The two kinds of count can be seen side by side in the same study. Wei and colleagues sequenced 1,526 mother-offspring pairs in 2019. They found 477 new heteroplasmies above 1%, and only three new variants above 80% heteroplasmic fraction, two of which they attribute to ascertainment bias.4
That is a gap of 160-fold to 470-fold, in one generation, between new variants detected at low levels and new variants already near fixation in the child. It is a snapshot, not a measured fate. Nobody followed the 477 to see how many became permanent, and a variant at 10% in a child can still drift to fixation in her descendants while one at 80% can still be lost. What the snapshot shows is how much a pedigree count depends on what is counted. The frequencies were measured in blood and other sampled tissue, which need not represent the germline that passes them on. Weighting each of the 477 by its frequency, which is what neutral theory says fixes, gives about a sixteenth of the raw count (worked below). The rate of lasting change itself has been counted directly only across many generations, on Norfolk Island.
Kimura's objection, and why it does not rescue the argument
There is a real technical reply here, and Carter has made it. Under Motoo Kimura's neutral theory, the long-run substitution rate equals the mutation rate, regardless of population size.10 A new mutation appears in one of N copies, so N mutations arise per generation and each has probability 1/N of fixing; the Ns cancel. So bottleneck or no bottleneck, over the long run the rate at which variants fix should equal the rate at which they arise.
Carter is right that critics who wave at "selection" as a general answer are being sloppy, and right that the neutral result is what it is.
The reply has three parts, and they are all measurements rather than arguments.
First, mitochondrial sites are not neutral, and this is observed rather than assumed. Toomas Kivisild's team showed in 2006 that the ratio of amino-acid-changing to silent variation declines with the age of the branch, meaning variants carried by healthy living people today are still being removed as time passes.35 A survey of 56,434 people found only about 10% of possible protein-changing variants and 1% of possible stop-gain variants actually present, against 55% of possible silent ones.36 These are people who are alive and well. The selection has not finished.
This bears directly on Carter's central defence. He argues that selection cannot be invoked to slow the clock because the published datasets already exclude diseased individuals: "natural selection has nothing to do here. It has already done its work by the time a person appears in a genetic study."3 The measurements above are of variation within healthy sampled people, and they show removal in progress. The claim and the refuting measurement can be printed side by side, and they are.
Second, selection acts inside the germline, before anyone exists to be sampled. Mouse experiments show a severe mitochondrial mutation eliminated within four generations while a mild one persisted.37 A study of human primordial germ cells found a selection signature against protein-changing, tRNA and control-region variants.38 deCODE's Icelandic data show negative selection operating inside ordinary pedigrees.12 Even in mice engineered to make mitochondrial mutations rapidly, James Stewart's team found the germline removing protein-changing variants.39 A variant can lower reproductive success slightly without causing any diagnosed disease, and selection can act among mitochondrial copies, cells, developing eggs and embryos before a person ever enters a study. None of this is touched by "the sampled adults were healthy."
How big the effect is depends on the region and the model, and no study supports a single universal figure. Soares' fitted correction changes the whole-molecule rate by about 1.4-fold across its range; Brenna Henn's team found about a fivefold decline for the hypervariable regions and about twofold for the coding region, and also weighed demographic explanations such as serial bottlenecks.6 40 Multiplying corrections taken from different analyses shows the scale of the gap, but it does not show the factors are independent. A stronger test would fit them jointly in one dataset and check the result in families not used to fit it.
Third, and decisively, the whole debate can be skipped. Instead of measuring the appearing rate and correcting it, measure the fixing rate directly, in a real pedigree, over the whole genome. Two studies have done exactly that, and their answer is the next section.
The test that settles it
Nathaniel Jeanson himself named the test his argument needed. In the discussion section of the paper that carries his rate, he wrote:
"The only remaining caveat to the present results is whether the mutation rate reported in Ding et al. (2015) represents a germline rate rather than a somatic mutation rate. To confirm germline transmission in the future, the DNA sequences from at least three successive generations must be sequenced to demonstrate that variants were not artifacts of mutation accumulation in non-gonadal cells."20
Seven family studies since 2013 bear on it. They improve the evidence while making any single headline rate harder to defend:
| Study | Sample | Relevant result |
|---|---|---|
| Guo 2013 | 26 mother-child pairs; median sequencing depth 3,981 reads | No homoplasmic differences within any family |
| Rebolledo-Jaramillo 2014 | 39 mother-child pairs; blood and cheek samples | Strong frequency shifts; effective bottleneck about 30 to 35; model-derived rate 1.3 × 10⁻⁸ per site per year |
| Wei 2019 | 1,526 mother-child transmissions | 477 new heteroplasmies; only three above 80% frequency |
| Zaidi 2019 | 345 people in 96 families; 249 transmissions; two tissues | Germline bottleneck about 7 to 10 units; selection and maternal-age effects |
| Connell 2022 | 225 people in 45 Norfolk Island maternal lineages; 345 transmissions | Nine mutations: seven heteroplasmies and two homoplasmic changes |
| Árnadóttir 2024 | 116,663 maternal transmissions in Iceland | 8,199 detected mutations; the frequency threshold and the transmission model decide what the count means |
| Arbeithuber 2025 | 80 single eggs from 22 women; 70 transmissions in the rate calculation | 52 qualifying new mutations; no rise in egg mutation frequency with the mother's age |
Every rate measurement, in one place gives the region, threshold and counting rule for each of these, and for the older studies by Howell, Cavelier, Sigurðardóttir, Heyer, Forster, Santos and Madrigal.41 33 4 34 5 12 42
Jeanson's three-generation test has now been run twice.
Norfolk Island, 2022. Connell and colleagues sequenced the complete mitochondrial genome across 45 maternal lineages in a documented multi-generation genealogy: 225 individuals, 345 mother-child transmissions.5 They found nine mutations. Seven were heteroplasmic. Two were fixed changes.
Set that against the prediction. Jeanson's rate is 63 mutations in 398 transmissions, so across 345 transmissions it predicts 63/398 × 345 = 54.6. Observed: 2. The probability of two or fewer under his rate is about 3 × 10-21.
That probability is conditional, and the conditions should be stated. It treats every change as independent, every qualifying change as detectable, and the rate as constant. It is a simple Poisson calculation, not a significance test that Connell's team ran on Jeanson's model using their full sampling design. Historical transmissions are reconstructed from surviving descendants, so what can be detected depends on who was sampled. The section below tests the one design feature that could hide changes, the count of transmissions, and finds it can hide at most about 15% of them. A gap of 54.6 against 2 survives any of these caveats; the exponent does not need to be taken literally.
Converted to a rate, Connell's fixed changes give 1.30 × 10⁻⁸ per site per year. The phylogenetic rate is 1.665 × 10⁻⁸. They are statistically indistinguishable, and the pedigree figure was obtained with no ape and no radiocarbon.
Two changes are still only two changes, and the uncertainty is wide. Connell's own 95% interval for the fixed-only rate runs from 0.003 to 0.047 changes per site per million years. Divided into Behar's 57.1, that interval puts Eve anywhere from about 73,000 years to 1.15 million years.5 23 The point estimate is about 246,000 years at 25 years a generation, from 2 changes in 345 transmissions, which is 0.00580 per transmission. Connell's published yearly rate converted to a 25-year generation is a slightly different quantity, 0.00538, and gives about 264,000 years. Connell's team measured an average maternal generation of 26.9 years on Norfolk Island,5 and at that interval every age from their count rises by 7.6%. So the honest statement is that the decisive family study places Eve somewhere between 73,000 years and a million, and nowhere near 6,000.
But the paper's own abstract says the opposite, and that has to be dealt with head-on. Connell's abstract reads: "Nine mutations (including two transitions and seven cases of heteroplasmy) were observed, resulting in a rate of 0.058 mutations/site/million years (95% CI 0.031–0.108). These mutation rates are approximately 16 times higher than estimates derived from phylogenetic analysis."5 A reader who checks the source will hit that sentence immediately, and it appears to contradict everything above. It does not, and the paper's own tables show why.
First, the 16 is attached to the wrong rate. The 0.058 figure counts all nine mutations, the seven heteroplasmies included. It is not the fixed-change rate. Connell's own Table 2 gives both, and the fixed-only figure is 0.013 mutations per site per million years: the 1.30 × 10⁻⁸ above. The two differ by a factor of 4.5 in the same 345 transmissions.
Second, it counts somatic mutations too, and the authors say so. Verbatim: "In this study, the rates calculated for the NI population included all mutations (heteroplasmy, germline, somatic)."5 A somatic mutation is one that happened in the sampled tissue during the donor's own lifetime. It is not inherited by anyone and cannot appear in any clock.
Third, and this is the part that resolves it, the 16 is not a phylogenetic comparison at all. Track the number down and it comes from a single sentence in the discussion: "Santos et al. reported a mutation rate of 0.074 mutations/site/Myr (16 times lower than the rate for NI: 1.2 mutations/site/Myr–both using a generation time of 25 years), however their rate only included substitutions (including heteroplasmy) with a germinal origin present in women fixed at the individual level."5 1.201 ÷ 0.074 = 16.2. Santos 2005 is a pedigree study, not a phylogenetic one, and Connell's own sentence gives the reason for the gap in the same breath: Santos counted only changes that would become fixed, Norfolk Island counted everything detected. The ratio measures inclusion criteria, not method. It is also a hypervariable-region-1 comparison, not a whole-genome one.
What the paper's whole-genome table actually contains. Table 3, standardised by Connell's own team to a 25-year generation, lists for the complete molecule: the Norfolk Island rate at 0.063, three ancient-DNA rates at 0.019, 0.021 and 0.024, and one pedigree fixation rate at 0.011. There is no phylogenetic whole-genome rate in the table at all. The largest genuine pedigree-versus-phylogenetic ratio anywhere in it is 12.5-fold, in hypervariable region 1, against Horai's figure of 0.103, and Horai's hypervariable-region rate was not measured but derived, by assuming the D-loop runs 1.8 times faster than synonymous sites.
And Connell's fixed-only rate is slower than every ancient-DNA rate in their own table. 0.013 against 0.019, 0.021 and 0.024. Their conclusion says what follows from that, and it is the thesis of this article in the authors' own words: "If mutations arise randomly in the mtGenome, these results suggest that newly arising mutations in the human mitochondrial coding region are eliminated before they reach a detectable frequency."5
How the young-earth literature reads Norfolk Island
One author has engaged with it, twice, and nobody else has.
A search of every citing work indexed for Connell, eighteen of them, turns up no creationist venue. Domain searches of creation.com, Answers in Genesis, Answers Research Journal, the Institute for Creation Research and the Creation Research Society return nothing on it. Nathaniel Jeanson's most recent mitochondrial paper, published in 2025, contains no occurrence of Connell, Norfolk, Árnadóttir or deCODE at all.43 The study that most directly tests his rate has not been addressed by him.
His most recent word on the objection itself is spoken, not printed. Asked in a March 2026 interview for "the best way to just shut it down", the critics' charge that he treats a mutation rate as a substitution rate, he defined the mutation rate as "how fast or slow does mom mutate the DNA to daughter," put it at "about an average of one mistake every five to ten generations," and stated the extrapolation in so many words: "I had been assuming that rate had been … consistent in the past. It's basically uniformitarianism."44 He had said the same thing more bluntly to the critic in question in June 2022: "I'm treating the mutation rate as a substitution rate, that this rate is consistent. … That's what I'm doing."45 The 2026 answer does not argue that the two rates are the same quantity. It makes three moves instead. Evolutionists assume the present is the key to the past in geology, so they cannot object when he does it in genetics. The textbook distinction between the rates is "a fundamentalist atheistic religion." And the assumption is a hypothesis he has tested, because "the predictions have been confirmed" by his 2019 Y-chromosome papers and "last summer with mitochondrial DNA."44 His closing line: "I'm equating substitution rate and mutation rate because the data says so."44
Two things about that answer. The mitochondrial confirmation he points to is the 2025 Americas paper, and its dating method does not apply a measured rate at all. It scales branch lengths inside an assumed young-earth span, in its own words, "an overall timeframe of 4,441 and 4,026 years from the node that joins haplogroup L and mtDNA macrohaplogroup M, rather than the 4,636 and 4,206 years that I employed for the rest of the haplogroups in the tree."43 A method that takes the timescale as an input cannot confirm it, and the paper says as much itself: "we don't yet know whether mtDNA acts like a simple biological clock."43 And the data that test the equation directly go unmentioned in the interview as in the paper: two fixed changes in 345 Norfolk Island transmissions, three near-fixations in Wei's 1,526, a bottleneck of three at deCODE. The distinction he calls religion is the one those studies settled by counting.
Robert Carter has addressed it, in a 2023 conference paper46 and in the current canonical creation.com statement on the question.3 Three things about his treatment should be said plainly, because two of them are to his credit.
His arithmetic on Connell is correct, which is more than can be said for his handling of Howell and Madrigal in the same endnotes. He converts it as "0.058e-6 μ/site year × 16,569 sites × 30 years/generation" and gets 0.029 mutations per generation. He does not double it and he does not rescale it, right on both counts, because Connell's figure is already a per-lineage rate and already whole-genome. The errors that inflate his other two conversions do not apply here and he did not make them.
He concedes the result damages his position, in print, twice. "These rates are a bit too slow for the creationist (we'll deal with that later) and a bit too fast for the evolutionist." And later: "the reported 'genealogical' mtDNA mutation rates are a bit too slow for the creationists."3 The deCODE study gets the same treatment: 0.07 mutations per generation, "about twice as fast as the Norfolk Island population," and still too slow for him. Publishing a number that hurts your own case and saying so is better practice than most of the literature this article surveys.
And he noticed the same oddity in Connell's abstract that anyone checking the source notices, from the other direction: "Even though their estimate equated to only 0.029 mutations per generation, they claim this was 16 times higher than typical phylogenetic estimates."46
His three escapes are patriarchal drive, refusing the proxy, and relocating Eve. The first is answered above and again below. The second, that modern Icelanders should not stand in for everyone who ever lived, is a real question and gets its own objection at the end of this article. The third is that if Noah's daughters-in-law shared a maternal line, "it is entirely possible that every mutation in the tree occurred post-Flood," leaving only a few dozen mutations over roughly 150 generations to explain.
Two things nobody on that side does. First, no young-earth source anywhere uses Connell's fixed-only rate. The figure of 0.013 mutations per site per million years, 0.0065 per generation, appears in none of it. Carter uses 0.058, which counts the seven heteroplasmies and, by the authors' own statement, somatic mutations. Second, nobody disputes the measurement. Not one source argues that the two fixed changes are miscounted or the study flawed. The response is to reinterpret the timeline rather than challenge the data, and that is the right instinct even though the reinterpretation does not work.
Denmark and Finland, 2013. Guo and colleagues sequenced 26 mother-child pairs at a median depth of 3,981-fold: more than twenty times deeper than the Sardinian data Jeanson's rate is built on. Their finding, verbatim: "Homoplasmic SNPs were inherited without exception within each family."41 Zero permanent changes in 26 transmissions where Jeanson's rate predicts 4.1.
Combine every whole-genome pedigree study except the one Jeanson relies on and you get 5 permanent changes in 1,897 transmissions: 0.0026 per genome per generation. Jeanson's figure is sixty times higher.
Set the fixation-only pedigree measurements beside the phylogenetic rate they are supposed to contradict:
| Study | Design | Fixed changes | Rate, per site per year |
|---|---|---|---|
| Guo 2013 | 26 transmissions, 3,981× depth | 0 | — |
| Connell 2022 (Norfolk Island) | 345 transmissions, 45 lineages | 2 | 1.30 × 10⁻⁸ |
| Phylogenetic rate for comparison | Soares 2009 | — | 1.665 × 10⁻⁸ |
So for whole-genome fixation there is no pedigree-versus-phylogeny discrepancy to explain. That is the single most important fact in this article. When the same quantity is measured both ways the two methods agree, and the famous discrepancy lives entirely in the comparison of appearing rates to fixing rates.
Notice what this does not require. It does not require selection. It does not require the clock to slow down. It is drift through the germline bottleneck, which is arithmetic.
Where the 63 came from
This leaves an obvious question. If the true rate of permanent change is near 0.003 per generation, where did Jeanson's 63 mutations in 398 transmissions come from?
They come from a single study, Ding et al. 2015, which sequenced lymphocytes from about 2,000 Sardinians at roughly 180-fold coverage, and which was not measuring a mutation rate at all. It was measuring concordance, and reported that mothers and children "share essentially all homoplasmies," 99.5% of them.24 Jeanson repurposed the 0.5% discordance as a mutation count.
His reading of their table is numerically exact. But the discordance has a signature, and it is visible in his own numbers.
Of the 63 differences, 35 are variants present in the child and absent in the mother: gains, which is what a mutation looks like. The other 28 are variants present in the mother and absent in the child: losses. For a loss to be a mutation, the site must not merely mutate but revert to precisely the reference base.
Test that against Jeanson's own rate. Those 28 events would have to occur at the 7,266 specific sites where the mothers carried a variant. At 9.55 × 10⁻⁶ per site per generation, the expected number is:
7,266 × 9.55e-6 = 0.069 eventsObserved: 28. That is 403 times more than his own model permits. A near-symmetric mixture of 35 gains and 28 losses is not what mutation produces. It is what genotype-calling discordance produces at 180-fold coverage, which is precisely the coverage Ding's team reported, and precisely why Guo's 3,981-fold data found none.
This objection needs no evolutionary premise at all. It is Jeanson's own rate applied to his own data.
Iceland: one count, several conversions
The largest family study ever run gives one count and several ages, and the spread comes from the conversion, not the data. deCODE followed 116,663 mother-child transmissions in Iceland and found 8,199 mutations, 0.0703 per transmission.12 Taken raw that lands at about 24,000 years, four times too old for a young earth and six times too young for the standard figure. At deCODE's own implied generation of 29.3 years it is that figure; at the 25 years used in this article's table it is about 20,300.
But it is not a fixation rate, and deCODE says so. Their detection rule was "a minimum read frequency threshold of 0.05 for detecting mutations in individuals, requiring at least one carrier to have a read frequency of ≥0.1."12 A variant present in five per cent of a child's mitochondria counts. That is a measurement of mutations appearing, so the 4-fold row compares an arising rate against a requirement defined by fixation: the same unit error this article spends a section on. The row above it divides by deCODE's own bottleneck of about 3 and gets 61,000 years, ten times too old. That is a sensitivity check, not a corrected rate. An effective bottleneck of three units says how fast frequencies shift between generations; it does not mean every detected variant sits at a third of the child's mitochondria, so it does not say what share of them will last.
One dataset, three answers, and the spread is the story. Taken raw, deCODE's 0.0703 mutations per transmission is what a 5%-threshold instrument detected: 24,000 years. Divide by their own bottleneck of about 3: 61,000 years. Apply the full chain Rebolledo-Jaramillo used on their own data, divide the detected count by 2 ln(1/θ − 1), which for a 5% threshold is 5.89, then divide by the bottleneck, and it is about 360,000 years, older than the phylogenetic estimate. A fifteenfold range with no new data in it at all.
That last figure should not be quoted as a result. Rebolledo's correction was derived for single mother-child transmissions, while deCODE traced whole matrilines across many generations, so the formula almost certainly over-corrects here. It is not a demonstrated limit either. It is reported to show how far the answer moves with the conversion: the conversion, not the counting, is where this entire dispute lives. Both sides have quoted deCODE's raw figure as though it were a clock. It is not a clock until somebody says which of those three numbers they mean.
The authors say so themselves, twice. In the discussion: "Increased sensitivity in the detection of mutations in pedigrees leads to greater estimates of mutation rates. This leads to a greater discrepancy with mutation rates inferred from phylogenies because most germline mtDNA mutations are lost soon after they occur due to intergenerational drift in heteroplasmy frequency." And under Limitations: "The mutation rates reported here are dependent on sensitivity criteria applied in the detection of mutations, making direct comparison between different pedigree studies challenging. An obvious corollary is that the true rate of mutation in the mtDNA germline must be substantially higher than reported here."12
They demonstrate it against a named study, too. Their coding-region rate is 9.79 × 10⁻⁸ per base per year against Connell's 2.59 × 10⁻⁸, and they attribute the difference to one thing: Connell used "a higher frequency threshold (0.2) … for detecting mutation events."12 Two pedigree studies, a factor of four apart, and the largest of them says the gap is the detection threshold. A pedigree mutation rate is not a property of the population. It is partly a property of the instrument.
They also measured the saturation directly. Comparing their 8,199 mutations against Soares' phylogeny, control-region mutations in the pedigrees hit 19.7% fewer distinct positions and were 65.3% more likely to strike the same position twice (both p < 1 × 10⁻⁵). Their conclusion: "a substantial number of mutations at hypermutable positions are evidently missed in phylogenies … particularly on long branches."12 That is Pääbo's 1998 hot-spot guess and Heyer's 2001 measurement, confirmed on 8,199 events. Push a short-term rate out past the window it was measured over and it will overstate, which is what Peterson and Masel's 8,400-year figure is telling us.
The count itself holds up. The authors checked possible false positives in additional tissues and found 3 among 284 tested events carried by more than one person, and 9 among 110 tested events carried by one person. Single-carrier events made up 69% of all detections. Even so, a defender cannot argue the raw count away as false positives: the rates were similar on branches with more than one descendant, where 2,540 of 3,197 mutations are seen in at least two carriers, and on branches with only one.12 And the regional rates add up: 0.0443 coding-region events plus 0.0267 control-region events per transmission gives about 0.0710, against the total of 0.0703.
The egg study
The fastest human rate ever measured is mostly a detection threshold, and when the threshold is matched it agrees with deCODE.
In 2025 Barbara Arbeithuber's team used duplex sequencing, which reads both strands of each original DNA molecule to tell real variants from laboratory errors, on 80 single eggs from 22 women aged 20 to 42, with each woman's blood and saliva for comparison. Their rate calculation used 52 new mutations present in at least 1% of an egg's copies, across 70 mother-to-egg transmissions sequenced deeply enough: about 0.743 detected mutations per transmission.42 Their regional rates were 3.95 × 10⁻⁴ per D-loop site per generation and 1.95 × 10⁻⁵ per coding-region site, where "coding" means the protein, ribosomal RNA and transfer RNA genes. Multiplied by their lengths, that is about 0.443 D-loop events and 0.300 coding-region events. The 88 bases outside those categories have no rate of their own and should not be given the coding rate.42
Inserted into the 57.1-change clock at 25-year generations, 0.743 gives about 1,900 years. That is this article's arithmetic, not a date the authors published, and it shows the danger of treating detected variants as lasting changes. deCODE predicted exactly this kind of result in print: "the true rate of mutation in the mtDNA germline must be substantially higher than reported here."12
Match the cutoff and most of the speed disappears:
| Coding-region estimate | Frequency cutoff | Mutations per site per generation |
|---|---|---|
| Arbeithuber 2025, eggs | 1% | 1.95 × 10⁻⁵ |
| Arbeithuber 2025, same eggs | 5% | 2.50 × 10⁻⁶ |
| Árnadóttir 2024, Icelandic pedigrees | 5%, with one carrier at 10% or more | 2.87 × 10⁻⁶ |
At the same 5% cutoff, the egg study's coding-region rate falls eightfold and lands in the same range as deCODE's pedigree estimate, as the authors themselves point out.42 The D-loop rate does not close the same way: at a similar 1% cutoff it stays about five times Wei's pedigree estimate, and that comparison does not establish why.
The eggs are not the start of the process. A mature egg has already been through development, drift and biological filtering, and the study did not follow any children. So the egg count is closer to the germline question than a blood count, but it is not a count of every mutation produced, and it is not a count of the changes that last. The paper itself reports frequency-dependent selection among the variants.
The bottleneck results make the same point from another side. Counting every inherited heteroplasmy, the effective bottleneck came out at about 909 units. Counting only sites where a variant reached 1%, it came out at about 30. Both intervals were very wide. Split by the mother's age, the 1% analysis gave about 25, 39 and 28 units for the young, middle and older groups, "not significantly different."42 None of this supports treating a bottleneck of three, ten or thirty as a fixed physical divisor for every study's count.
A 2026 study of blood shows why blood counts need the same caution. Gupta and colleagues analysed 736,038 people, keeping 620,385 after quality control, and found that rare mitochondrial mutations become detectable as particular blood-cell clones expand with age.47 That is evidence about somatic variation in blood, not a maternal clock. It is one more reason to keep the production of a mutation apart from the growth of a population of cells that already carries it.
Is there really a different long-term rate?
This is the question the whole dispute turns on, and on its face it sounds like special pleading: the rate was measured directly, in families, over documented generations, and now, over long periods, the rate is said to be different. A skeptic is right to be suspicious. A rate that changes whenever it needs to is not a rate.
The claim is partly true, partly a category error, and the two parts are separable and separately measurable.
Most of the apparent gap is not a rate difference at all. It is two quantities counted under one name, variants appearing versus variants taking over, and the previous section shows what happens when the same quantity is measured both ways: the discrepancy disappears, with no selection and no slowing clock required.
The rest is priced below.
The one-line conversion that neither side writes down
There is a cleaner way to state all of this, and it follows directly from the neutral theory Carter correctly insists on.
Under neutrality, a variant present at frequency f fixes with probability f. So the expected number of eventual fixations per transmission is just the sum of the heteroplasmy fractions of all the new variants in the child. That sum is the substitution rate. No bottleneck model, no selection, no fitted parameter: it is Kimura's own result applied to the quantity pedigree studies actually report.
Apply it to Wei's published numbers. 477 de novo variants, mean heteroplasmy fraction 6.2%, 1,526 transmissions:
477 × 0.062 / 1,526 = 0.0194 mutations per genome per generationThe raw appearance rate was 0.31 per generation, about 31 times the tip-calibrated substitution rate. After one line of arithmetic it is 0.0194: 1.9 times the tip-calibrated rate.
One line of neutral theory removes 94% of the gap, with no selection invoked at all. That is the heart of the answer, and it is why the apparent discrepancy is not evidence of a mysterious changing clock. It is what happens when you count variants by presence instead of weighting them by their probability of surviving.
The genuine time-dependency, and how big it is
Having said that, the answer is not simply "there is no such thing as a long-term rate." There is a real effect, it has an identified mechanism, and it has been measured independently rather than fitted to close the gap.
The mechanism is purifying selection on variants that are still segregating. A slightly harmful variant can be present in living, healthy people and still be on its way out. Over a few thousand years those variants disappear, so a rate measured over a short window counts them and a rate measured over a long window does not.
This is observed, not assumed:
- The ratio of amino-acid-changing to silent variation declines with the age of the branch.35 Older branches have been purged; younger ones have not.
- Across 56,434 healthy people, about 10% of possible protein-changing variants and 1% of possible stop-gain variants are actually present, against 55% of possible silent ones.36
- In ancient penguin genomes up to 44,000 years old, the rate at constrained sites varies more than twofold with time while "the rate of evolution at synonymous sites remains the same."48 That last clause is the crucial control. If short-term clocks ran fast because less time had actually elapsed, silent sites would be inflated too. They are not. The inflation is confined to exactly the sites selection acts on.
How big is the effect? Across the whole molecule, only about 1.41×: that is Soares' own correction curve measured from the tips to its asymptote.6 Selection accounts for a factor of 1.4 out of a gap that starts at 7 to 31. Anyone claiming selection explains the discrepancy is overstating; anyone claiming it does nothing is contradicted by the measurements above.
The one study that set out to measure this in humans deserves to be quoted, and it cuts both ways. Brenna Henn's team calibrated the human mitochondrial clock on fourteen separate archaeological settlement dates, then asked how the answer depends on how far back the calibration sits.40 Their finding, verbatim: "a rapid decay in evolutionary mutation rate between approximately 2,500 and 50,000 years ago and a slow decay from 50,000 to 6 Ma." The decay is real and they measured its size.
The size is the part that matters, and it is different in the two halves of the molecule. Relative to pedigree rates, their hypervariable-region estimates "decline by about 5-fold, whereas the coding region rates decline only about 2-fold."40
Give the young-earth side the first number, in full. A fivefold short-term inflation in the control region is a mainstream measurement, and the control region is exactly where Parsons measured, exactly where the 6,500-year figure came from, and exactly where most of the classic pedigree literature sits. Anyone quoting a control-region pedigree rate as a long-run clock has a real effect working in their favour, and it is larger than this article's headline figure.
And inside the young-earth window itself, Henn's control-region calibrations reproduce the pedigree rate. Her team's six youngest hypervariable-region calibrations, settlements dated archaeologically to between 2,500 and 5,000 years ago from the Canary Islands to Samoa and the Marianas, average 0.90 per base per million years against Howell's pedigree 0.95. In their words: "Genealogy-based rate estimates between 2,500 and 5,000 years ago are indistinguishable from pedigree-based mutation rate estimate (tables 1 and 2). This remains true across different haplogroups and populations from vastly different geographic locations, for example, Canary Islands versus Samoa."40 That is the best calibration evidence on file for the young-earth side: for the control region, every calibration that falls inside a 6,000-year window gives the fast rate.
Two replies limit it. A founding population brings diversity with it, which a founder analysis counts as mutation after arrival, so the youngest calibrations are biased upward. And the coding region, which holds 93% of the sites and most of Eve's depth, shows no fast rate even at its youngest calibration: the Polynesian haplogroup B4a1a1, about 4,300 years old, gives 0.046 per base per million years, "virtually no change in the coding region rate over the 10,000 year span between the Polynesian and American estimates."40 Henn's rates are divergence rates, so 0.046 is a mutation rate of 2.3 × 10⁻⁸ per site per year, the same as the ancient-DNA tip rates. Applied to the control region alone, the pedigree rate gives Eve about 15,000 to 32,000 years, as the control-region check showed.
Then note what it does not reach. The coding region is 93% of the molecule, carries 82% of the archaic distance, and declines about twofold, which is the figure this section arrived at independently. Henn's own proposed mechanism is not selection at all but demography, "serial bottlenecks prior to the Holocene." So the effect is confirmed, its size is confirmed for the part of the molecule that decides the argument, and its cause is less settled than this section implies.
The experiment that settles whether this is really selection: Sankar Subramanian and David Lambert compared apparent rates across five calibration depths from 18,000 years to 6 million. The rate at amino-acid-changing sites falls 10.8-fold. The rate at silent sites is flat, ratio 1.2.49 If the apparent decline happened because the true elapsed time were far shorter than assumed, silent sites would decline just as steeply. They do not.
Better still, they give a version that needs no dates at all: the ratio of changing to silent variation falls from 0.423 at the shallowest depth to 0.047 at the human-chimpanzee comparison, a ninefold decline that assumes no calibration whatsoever. The exact ratios still depend on the sequence model and the correction for sites that changed twice. Neither side of this debate cites it, and it is the cleanest discrimination available between "selection is removing variants" and "less time has passed than you think."
Saturation, which cuts the other way
A third effect works in the opposite direction and is usually left out. Some sites mutate so fast that they change repeatedly, and a comparison between two distant sequences counts a site that changed five times as one difference. This makes the long-term rate look artificially slow.
The concentration is startling: of 3,921 distinct variants on the worldwide tree, 458 of them, 12%, recur five or more times and carry half of all mutational events. Position 16519 alone accounts for 2% of every mutation in the human mitochondrial tree.
Genome-wide at human depth, though, the correction is modest: observed pairwise differences recover about 94% of true substitutions for a typical human pair and 87% for the deepest pairs. So saturation closes the gap from the other side by roughly 10%, not by a factor of several.
In the control region alone it is much worse, and this matters for which studies to trust. deCODE measured the control region mutating 8.3 times faster than the coding region, but the observed diversity ratio between those regions is only 4.6. Raw control-region counts therefore understate true substitutions by nearly twofold. That is exactly why control-region-only clocks, Parsons 1997, Howell 2003, Madrigal 2012, are the worst possible basis for a whole-genome argument, and why this article leans on whole-genome studies wherever it can.
Does the accounting close?
This is the fair test of the whole explanation, and it is done in the open here rather than asserted.
Start from Wei's directly measured appearance rate and apply the three corrections in order:
| Step | Factor | Running value |
|---|---|---|
| De novo heteroplasmies per transmission (measured) | — | 0.3126 |
| Somatic contamination removed | ÷ 1.64 | 0.191 |
| Sum-of-frequencies conversion to fixations | ÷ 16.1 | 0.0118 |
| Purifying selection | ÷ 1.415 | 0.0084 |
| Target: tip-calibrated substitution rate | — | 0.0102 |
The accounting closes: in fact it slightly over-closes, landing at 0.8 to 1.0 times the target. Two independent published conversions bracket the same answer from opposite directions: Rebolledo-Jaramillo's bottleneck correction undershoots at 0.0045 and the sum-of-frequencies route overshoots at 0.0194.
The residual, and the one parameter genuinely unsettled
Nothing above is exact, and the honest residual is a factor of about two to three.
It rests on one number, and that number is the strongest thing left on the young-earth side of this question. The conversion doing most of the work depends on the effective number of units transmitted through the germline bottleneck, and nobody has ever directly measured the per-molecule germline mutation rate in a human. Published estimates run from 3 (deCODE), to 7–10 (Zaidi), to 30–35 with an interquartile range of 9–141 (Rebolledo-Jaramillo), to about 200 (Guo). deCODE's own survey of the studies using the same methodology narrows that to 2 to 32, averaging 8.1, or 5.7 once the outlying 32 is excluded, that outlier resting on 39 transmissions and mostly on low-frequency variants which they argue inflate the estimate.12 Guo's 200 comes from a different approach, and deCODE notes that such approaches "have not provided direct estimates." So the honest figure is a roughly sixteenfold spread among like-for-like estimates, not sixtyfold across mixed methods, still wide enough that anyone quoting a bottleneck-corrected rate to two significant figures is overstating what is known.
What that uncertainty does to the answer: if deCODE's 8,199 mutations sit at the frequency implied by their own bottleneck estimate of about 3, the resulting substitution rate is 0.023 per generation, or 2.3 times the tip-calibrated rate. That figure divides by the bottleneck and stops there. Rebolledo-Jaramillo's published chain has a step before it, divide the detected count by 2 ln(1/θ − 1) to recover the arising rate, which for deCODE's 5% threshold is a factor of 5.89, and applying both steps gives 0.004 per generation instead. The two answers differ sixfold from the same 8,199 mutations.
It is a real hole and it belongs in print. It also does not rescue the argument, for two reasons. A 6,000-year mitochondrial Eve requires 57.1 root-to-tip substitutions in 6,000 years, 23.4 times the tip-calibrated rate, so a residual of two to three leaves the argument short by a further factor of about eight. And Norfolk Island and Guo bypass the conversion entirely: they do not correct an appearing rate, they count fixations directly. The uncertainty in the bottleneck is real, and it is irrelevant to the studies that decide the question.
The verdict
Is there merit to the idea of a long-term rate different from the measured pedigree rate?
Yes, but far less than the argument needs, and mostly not for the reason the phrase suggests.
- Most of the apparent gap is not a rate difference. It is heteroplasmy counted as fixation. Measure fixation directly in a pedigree and the discrepancy disappears.
- A genuine time-dependent component exists, is caused mainly by ongoing purifying selection, is independently measured, and is about twofold in the coding region, decaying over a few thousand years. That is a measured size for this region and these models, not a universal ceiling: Henn's team found about fivefold for the control region, and the size of the effect depends on the region and the model.
- A third effect makes long-term rates look artificially slow, which means the raw gap overstates the real one.
- Every part of this has been checked in a species where the true history is known, and the correction recovered the right answer there.
A 6,000-year mitochondrial Eve needs the long-run rate to be about 21 to 27 times the tip-calibrated rates (Posth's 2.74 × 10⁻⁸ to Rieux's 2.14 × 10⁻⁸ per site per year, against the 57.1-change depth at 25-year generations). The defensible time-dependency for the coding region is two.
Clocks where the answer is already known
The cleanest way to test a clock is on a history that is known independently. Four such cases exist, and they are among the most underused evidence in this subject.
Adélie penguins are the best dataset in the world for this question, and they cut against the young-earth reading in an instructive way. They are the only species with both a properly modelled pedigree mutation rate and a radiocarbon-calibrated ancient-DNA substitution rate for the same 344 base pairs of DNA.50
| Method | Rate, mutations per site per Myr |
|---|---|
| Pedigree, counting every heteroplasmy as a mutation | 54.9 |
| Pedigree, modelling heteroplasmy persistence | 0.55 (95% interval 0.29 to 0.88) |
| Ancient DNA, 162 radiocarbon-dated bones over about 37,000 years | 0.86 (0.53 to 1.17) |
An apparent hundredfold discrepancy, in a species whose history is independently known, vanished once the heteroplasmy accounting was corrected.51 The corrected pedigree rate and the ancient-DNA rate are statistically indistinguishable, p = 0.13. Millar's team state plainly that counting every heteroplasmy "over-estimates μ by a factor of 5."
The human number matches. Norfolk Island gives 0.058 mutations per site per Myr including heteroplasmy and 0.013 excluding it: a 4.5-fold difference against the penguins' fivefold.5 Almost the whole human "fast clock" is heteroplasmy accounting, and that can be asserted with confidence because the identical correction, in a different species, recovered a rate already known to be right.
Bison is the case creationists should examine hardest. Shapiro's team calibrated the bison control-region rate directly on 220 radiocarbon-dated fossils and got 32% per million years, which agrees with the independently fossil-calibrated cattle rates of 30.1% and 38%.52 An independent clock check came out right.
Documented human foundings do not show a fast clock. Tristan da Cunha was founded by five women in the early nineteenth century: zero mutations in 108 transmissions. A Swedish study of 33 families: zero in 292.1 Gibbons reports both null results in the same article that contains the famous sentence.
One argument that should be dropped. The research notes behind this article raise the "cattle mitochondrial Eve at 200,000 years versus domestication at 10,000" as a clock failure. It is not one. Loftus and colleagues read their own data as two separate domestications of two already-divergent aurochs lineages, and Ruth Bollongino's team, fitting ancient Iranian and modern cattle sequences to a domestication model, estimate "that around 80 female aurochs were initially domesticated."53 Domestication sampled standing wild variation; there was never a one-female bottleneck to date. This argument should be dropped or rewritten.
The double edge
There is a real finding here for the young-earth side, and it deserves stating at full strength: the short-term-fast, long-term-slow pattern is universal. It appears in chickens (31 to 63-fold), brown bears (about 9-fold), cattle (about 20-fold), nematodes, and fruit flies. A meta-analysis of 239 metazoan mitochondrial rate estimates found a significant negative slope of rate against calibration age in every group tested.54
But universality is a two-edged sword, and the edge points the wrong way for the argument. If the same inflation appears in every species tested, in nuclear DNA, in bacteria and in viruses, then it is a property of rate estimation, not evidence that any particular species is young. The identical logic applied to fruit-fly mutation-accumulation rates would date the split between fruit-fly species to a few thousand years.
Jeanson has made exactly that comparison, and one part of his method is better than his human clock. In 2013 he compared the mitochondrial diversity within Caenorhabditis worms, Drosophila flies and Daphnia water fleas with mutation rates from laboratory mutation-accumulation lines. His Table 6 lists the years per mutation each timescale needs against the "actual" laboratory figure: Caenorhabditis 21,752 for evolution and 12 for creation against 6 to 11 measured; Drosophila 34,247 and 17 against 9 to 202; Daphnia 23,259 and 31 against 48 to 62.55 Mutation-accumulation lines pass through a single individual each generation for hundreds of generations, so most of the mutations they count have had time to drift to fixation or loss inside the line. So these invertebrate comparisons largely escape the appearing-versus-staying objection that sinks his human clock. That is a fair point in his favour, and none of the earlier versions of this article made it.
Three limits apply. The escape is partial, because such lines still contain some heteroplasmies. The lines suppress purifying selection by design, so their rates overstate the natural rate by whatever share selection removes. And comparing species requires those species to share one created sequence a few thousand years ago, a separate claim with its own nuclear evidence. The one input Jeanson used that has since been re-measured moved against him. Anke Konrad's team ran C. elegans lines for 409 generations and found a rate of 4.32 × 10⁻⁸ per site per generation, noting "a greater than two-fold difference" from the earlier rate it replaces.56 At that rate the worm genus needs about 16 to 18 years per mutation, not 12, so the Caenorhabditis match moves from inside the measured range to about 1.3 to 1.5 times short, at laboratory generation times that wild worms do not keep.57
Peterson and Masel derived the effect from standard population genetics and showed how long it should last: for hominid mitochondrial DNA, roughly Ne generations, or about 8,400 years. That number cuts both ways honestly. It says the pedigree rate is legitimately applicable out to a few thousand years. It also says using it at 150,000 years is invalid, and that the inflation is expected on the conventional model without any young ancestor at all.
What ancient DNA measures
The pedigree result above is sufficient on its own. The ancient-DNA evidence is worth stating anyway, because it is independent, because it is what the young-earth literature has most conspicuously declined to engage, and because one part of it survives even a thoroughgoing scepticism about radiometric dating.
Jeanson disposes of the entire field in a sentence: "DNA sequences from fossils are too degraded to be useful for comparative DNA analyses today."20 That is an assertion. The Ust'-Ishim femur was sequenced at 4,439-fold coverage with 0.50% contamination.58
Ötzi: the one ancient sample that cannot be waved away
Start with the sample a young-earth reader has least reason to dispute, and be clear about what is still disputed.
Ötzi the Iceman died about 5,300 years ago. His body has been radiocarbon dated repeatedly by several laboratories, the date sits in the part of the calibration curve anchored by tree rings, and he was found with a copper axe and Chalcolithic clothing that agree with it. Five thousand three hundred years is numerically inside a 6,000-year timeline. It does not follow that young-earth chronologies accept it. On the common Masoretic reckoning the Flood fell about 4,350 years ago, so a calendar age of 5,300 years puts Ötzi before the Flood, and a young-earth reader has to compress his radiocarbon date to fit him after it. That compression is exactly what the consistency test below examines.
Even so, Ötzi is the shortest and best-anchored test of the long-run rate available, and it does not need the full 5,300 years to do its main job. Jeanson's rate predicts about 33.5 missing changes, and a compressed date shrinks that prediction only in proportion.
His lineage stopped 5,300 years before ours did, so his mitochondrial genome should be missing mutations that living people have accumulated since. How many depends entirely on the rate:
| Rate | Predicted missing mutations |
|---|---|
| deCODE 2024, threshold- and bottleneck-corrected | 0.7 |
| Connell 2022, Norfolk Island, fixed changes only | 1.1 |
| Soares 2009, phylogenetic | 1.5 |
| Rieux 2014, tip-calibrated | 1.9 |
| Fu 2013, tip-calibrated | 2.3 |
| Connell 2022, Norfolk Island, all nine mutations | 5.1 |
| Översti 2022, haplogroup U4, Holocene-only | 7.7 |
| deCODE 2024, every mutation detected | 12.4 |
| Jeanson 2015 pedigree | 33.5 |
So it was measured. Ötzi's genome and 250 modern mitochondrial genomes from his own haplogroup, K1, were downloaded from GenBank, aligned to the reference sequence, and compared. Indels and the known length polymorphisms were excluded. Ötzi's private branch was measured against the mean private branch of the 250 modern K1 sequences.
Result: Ötzi is missing 4.9 ± 2.6 mutations. Measured the other way, root-to-tip distance rather than private branch, it is 3.0 ± 2.8.
Against the predictions, in standard errors:
| Rate | z |
|---|---|
| deCODE 2024, fully corrected | −1.6 |
| Connell 2022, fixed changes only | −1.5 |
| Soares 2009 phylogenetic | −1.3 |
| Rieux 2014 tip-calibrated | −1.2 |
| Fu 2013 tip-calibrated | −1.0 |
| Connell 2022, all nine mutations | +0.1 |
| Översti 2022 Holocene-only | +1.1 |
| deCODE 2024, every mutation detected | +2.9 |
| Jeanson 2015 | +11.0 |
One trap in that table has to be named first.
Connell 2022 publishes two rates, and the more quotable one is the wrong one. The rate counting all nine mutations predicts 5.1 missing mutations and lands almost exactly on the observed 4.9: a near-perfect match at z = +0.1. It is also the rate that includes seven heteroplasmies and, by the authors' own statement, somatic mutations, so it is not a fixation rate and cannot be read as one. Connell's fixed-only rate is the like-for-like figure, and it predicts 1.1, at z = −1.5. The tidy answer here is the wrong answer, and an earlier version of this table made exactly that mistake.
What the corrected table shows is less tidy and more informative: every candidate rate from the phylogenetic figure down to the fully corrected deCODE figure sits between one and two standard errors below the observation, and only the uncorrected pedigree rates overshoot. Ötzi does not discriminate sharply among the slow rates, one 5,300-year-old genome cannot, but it excludes the fast ones, which is what it was brought in to do. And post-mortem damage adds spurious private variants, so the observed 4.9 is more likely an overestimate than an underestimate, which pulls the slow rates toward it rather than away.
Jeanson's rate is eleven standard errors out. It predicts Ötzi should be missing 5,300 ÷ 25 × 0.158 = 33.5 mutations. Modern K1 individuals carry only about 9 private mutations in total, so the prediction requires more missing mutations than the branch has room for.
The limitations are real and worth stating. A single sample gives wide error bars, and the measurement cannot distinguish the tip-calibrated rate from zero: the 95% interval includes no shortening at all. This test does not establish the slow rate on its own; the 229-genome regression below does that. What one sample can do is exclude a rate that is an order of magnitude too fast, and it does that decisively.
Compared against a broad global panel instead of his own haplogroup, the measured shortening drops to −0.7 ± 4.3, consistent with zero and slightly negative. That is the between-clade variance problem: Ötzi belongs to K1f, a branch that Ermini's team noted "has not yet been identified in modern European populations," so comparing him to distant relatives adds noise that has nothing to do with time. The K1 comparison is the right one, and both estimators on that panel give the same answer.
Note also which direction the remaining artifacts push. Post-mortem damage adds spurious variants to Ötzi's sequence, which makes his branch look longer and the shortening smaller. Contamination does the same. Both biases favour the young-earth answer, and the measurement survives them.
The code is at research/code/otzi_branch_shortening.py and the accession list and per-sequence variants are in research/data/.
The consistency test that does not depend on the dates
A young-earth reader will say the radiocarbon dates on these bones are wrong. Grant it, for the sake of argument. The data still contain a test.
Rieux's team took 21 radiocarbon-dated ancient genomes and used each one alone as the single calibration point, producing 21 estimates of the mutation rate. If the dates were meaningless, those estimates would scatter. Here is what they got, across samples ranging from 2,535 to 39,464 years old, a 15.6-fold range of age:
| Sample | Age (years) | Rate, ×10-8 per site per year |
|---|---|---|
| Dodge 152 | 2,535 | 2.351 |
| Saqqaq | 3,834 | 2.509 |
| Ötzi | 5,228 | 2.431 |
| La Braña 1 | 7,827 | 2.362 |
| Loschbour | 8,054 | 2.346 |
| Clovis (Anzick) | 12,631 | 2.281 |
| Oberkassel 998 | 14,020 | 2.358 |
| Dolní Věstonice 13 | 31,155 | 2.293 |
| Kostenki 14 | 37,985 | 2.268 |
| Tianyuan | 39,464 | 2.313 |
Twenty-one estimates, mean 2.391, standard deviation 0.077. The spread from highest to lowest is 11%, across a 15.6-fold range of sample age.32 The table shows ten of the 21.
These are not 21 independent experiments. Every run shares the same modern and ancient sequences, the same tree and the same substitution model; only the calibration point changes. So the result is a sensitivity test: under that shared model, no single dated sample pulls the rate far from the rest. The argument that follows inherits the same condition.
Now be careful about what this does and does not prove. If every radiocarbon date were wrong by the same multiplying factor, the consistency would survive untouched: the rate would just change by that factor. So linearity alone does not refute a uniform compression of the radiocarbon timescale.
What it does refute is a non-uniform one, and the standard young-earth radiocarbon model is emphatically non-uniform. It holds that dates within the last two or three millennia are approximately right, being anchored by tree rings and historically dated Egyptian material, while apparent ages balloon as one approaches the Flood because the pre-Flood world held far less carbon-14. That model makes a prediction here, and it can be checked:
- Dodge 152, dated 2,535 years, is inside the anchored range, so true age about 2,535 years.
- Tianyuan, dated 39,464 years, must be at most the age of the Flood, about 4,350 years.
- So the ratio of true ages is at most 1.7.
- The measured ratio of branch shortening between them is about 15.
Under the shared model, Tianyuan's lineage would have to have mutated roughly nine times faster than Dodge 152's over the same span. The largest lineage-to-lineage rate difference documented in human mitochondrial DNA is about threefold, and it is not a solid threefold: Översti and Palo's published 2.1-fold was called statistically non-significant by its own authors,59 and this article's refit of 229 ancient genomes reaches 3.2-fold only in a specification that one subclade carries by itself.60
The uniform-compression escape fares no better. To rescue a 6,000-year Eve by compressing every date by the same factor, that factor must be about 26, the gap between the tip-calibrated rate and the rate a 6,000-year Eve needs. Apply it:
- Tianyuan becomes 1,507 years old: around AD 520.
- Ötzi becomes 200 years old: around AD 1826.
- Dodge 152 becomes 97 years old.
Ötzi is the fatal one, for the reasons given above: repeat dating by several laboratories, a tree-ring-anchored stretch of the calibration curve, a copper axe and Chalcolithic clothing. A uniform 26-fold compression makes him a contemporary of Michael Faraday.
The same test, run here from raw sequence
No published paper tabulates the raw per-sample counts behind these regressions, so this article built one.
Sanni Översti and Jukka Palo published a list of 234 radiocarbon-dated ancient human mitochondrial genomes from haplogroup U, with GenBank accessions and calibrated dates.59 Every sequence was downloaded from GenBank, aligned to the reference sequence with a banded aligner written for the purpose, stripped of indels and the known length polymorphisms, and scored how many substitutions separate each sample from the haplogroup U node. That count was then regressed against the sample's radiocarbon date.
If the mitochondrial clock runs at the tip-calibrated rate, older samples should sit on shorter branches, and the slope of that line is the mutation rate.
From the 229 sequences that passed quality control:
| Quantity | Value |
|---|---|
| Samples | 229 |
| Age range | 1,475 to 37,985 cal BP |
| Samples younger than 4,500 cal BP | 82 |
| Slope, whole molecule | 2.58 × 10⁻⁸ per site per year |
| 95% confidence interval | 2.11 to 3.06 × 10⁻⁸ |
| t | 10.7 (p ≈ 10-21) |
| R² | 0.56 |
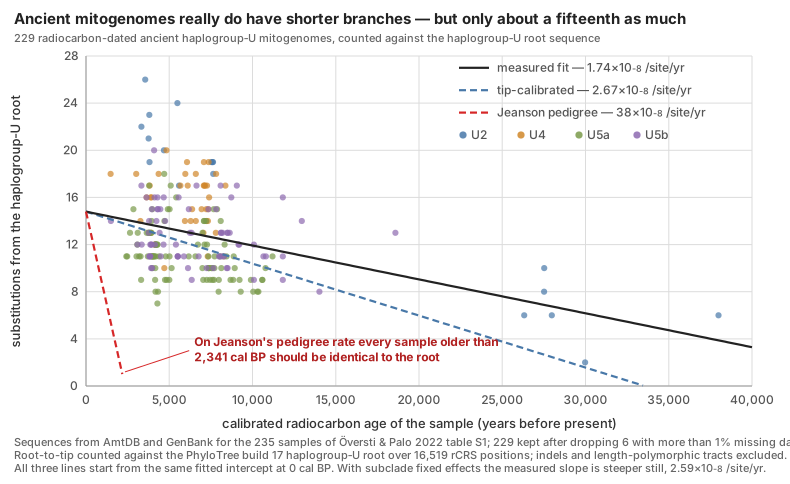
Measured from raw sequence, the rate is 2.58 × 10⁻⁸ substitutions per site per year. The published tip-calibrated rates run 2.1 to 2.8 × 10⁻⁸, the chimp-calibrated phylogenetic rate is 1.665 × 10⁻⁸, and Jeanson's pedigree rate converts to about 3.8 × 10⁻⁷. This lands squarely inside the first, near the second, and a factor of 15 below the third.
One modelling choice has to be declared. The four subclades of haplogroup U sit at different depths below the U node, with U2 tips averaging 22 substitutions from it and U5a tips 14, for reasons that have nothing to do with sample age. Pooling all 229 without accounting for that mixes between-clade depth into the age signal and biases the slope downward: the naive pooled fit gives 1.74 × 10⁻⁸ with R² = 0.14. Allowing each subclade its own intercept and fitting one common slope, the standard fix, gives the 2.58 × 10⁻⁸ above with R² = 0.56. Both numbers are reported here so a reader can see the effect of the choice, and both are far below the pedigree rate. An independent reimplementation over 16,519 retained positions gives 1.74 and 2.59 × 10⁻⁸, the same to rounding.
Notice what the young-earth rate would require. The fitted line starts at about 15 substitutions from the haplogroup U root at the present day. At Jeanson's rate of 0.158 mutations per genome per 25-year generation, that entire stock of accumulated difference is used up in about 2,340 years. So his rate requires that every one of the 227 samples older than 2,340 years be identical to the root sequence. All 227 differ from it, by a median of 12 substitutions. Kostenki 14, radiocarbon-dated to 37,985 years, still carries 6.
That is not a rate that is somewhat too fast. It is a rate that predicts the data should not exist.
One limitation has to be printed, and it is the sharpest objection a young-earth reader can make to this computation. Almost all of the statistical strength comes from samples dated outside the timeline that reader accepts. Restrict the fit by age and it decays fast.
| samples used | n | rate per site per year | 95% confidence interval |
|---|---|---|---|
| all, 1,475 to 37,985 cal BP | 229 | 2.58 × 10⁻⁸ | 2.11 – 3.06 × 10⁻⁸ |
| younger than 20,000 cal BP | 223 | 1.52 × 10⁻⁸ | 0.78 – 2.27 × 10⁻⁸ |
| younger than 10,000 cal BP | 206 | 1.47 × 10⁻⁸ | 0.48 – 2.47 × 10⁻⁸ |
| younger than 7,000 cal BP | 130 | 9.1 × 10⁻⁹ | −1.35 – 3.17 × 10⁻⁸, crosses zero |
| younger than 6,000 cal BP | 111 | 1.16 × 10⁻⁸ | −2.25 – 4.56 × 10⁻⁸, crosses zero |
| younger than 5,000 cal BP | 94 | 2.0 × 10⁻⁸ | −2.66 – 6.59 × 10⁻⁸, crosses zero |
Mean root-to-tip depth is essentially flat across the Holocene, 13.3 substitutions below 4,500 years and 13.2 between 4,500 and 10,000, and only falls beyond that. So inside the last 10,000 years these 229 genomes cannot tell one slow rate from another, and a reader who rejects the older dates is entitled to say the regression has not been tested in the window he cares about.
The R² makes the same point more sharply. With the subclade intercepts in, the overall R² is 0.56, but most of that is the intercepts. Sample age explains only about 0.34 of the variation left inside the subclades, and below 6,000 years it explains about 0.004.61 Inside a young-earth window, these data carry almost no clock signal at all. The intervals in the table use the ordinary regression error model; a negative lower limit means the data cannot detect a positive rate, not that the rate is negative, and none of them include the tree's shared ancestry or the uncertainty in the dates.
What survives the restriction is the part that matters here. Even using only the 206 Holocene samples, the upper bound on the rate is 2.47 × 10⁻⁸, which is fifteen times below Jeanson's equivalent of 3.8 × 10⁻⁷; even the non-significant fit below 7,000 years has an upper bound twelve times below it, and the fit below 6,000 years about eight times below it. The regression cannot discriminate among the slow rates within a young-earth timespan. It still excludes the fast one there.
The code and the per-sample table are in research/code/ and research/data/branch-shortening-per-sample.tsv, so any reader can re-run it.
The prediction that came true
One incident is worth reporting because it shows branch shortening is a real diagnostic signal rather than a modelling artifact.
Fu's team sequenced a bone fragment from the Cro-Magnon collection, archaeologically assumed to be about 30,000 years old. Its mitochondrial DNA belonged to haplogroup T2b1: a young, derived European lineage, entirely wrong for that age. So they radiocarbon-dated the bone itself rather than the shell it had been dated from:
"Surprisingly, the sample had a much younger age of about 700 years, suggesting a medieval origin. Consequently, this bone fragment has now been removed from the Cro-Magnon collection at the Musée de l'Homme in Paris."62
The genetics predicted a redating and the redating confirmed it.
Damage cannot manufacture this
The obvious objection is that ancient DNA is chemically degraded, and degradation might create the appearance of missing mutations. It works the other way.
Post-mortem damage, chiefly the deamination of cytosine, adds spurious variants to the ancient sample. Adding variants makes the ancient branch look longer, which makes the shortening look smaller and the inferred rate slower. Rieux's team measured the effect directly: modelling damage raised their rate by 4.2%.32 Modern contamination biases the same direction. Both artifacts make mitochondrial Eve look older than she is, not younger.
They also screened for it and it removed samples: four of thirty ancient genomes failed a deamination test and were dropped.32 This is not a field that assumes its data are clean.
The Flood model's own prediction
Everything above is the young-earth case failing on someone else's ground. What follows tests it on its own.
Genesis puts eight people on the Ark: Noah, his wife, their three sons, and the sons' three wives. Mitochondrial DNA passes only through women, and the sons do not pass on their mother's. So the maternal lines crossing the Flood number at most three.
That limits the number of founders. It does not fix the shape of the tree's root. The three wives' maternal lines all go back to Eve, about 1,656 years earlier, and nothing in Genesis says the wives were unrelated to one another. If two of them shared a more recent maternal ancestor than the third, their lines part in two steps: first the third wife's line splits off, then the other two split from each other. Three founders then sit on a two-way root. A three-way root would need all three lines to part from one woman with no mutation between the partings. Drawn as a tree:
Earlier maternal ancestor
├── Third wife's maternal line
└── Later maternal ancestor
    ├── First wife's maternal line
    └── Second wife's maternal line
Three women at the Flood, and a two-way tree, with no assumption about mutation rates. So the Ark does not predict a three-way root, and the absence of one does not refute three founding women. The reverse holds too: three large clusters on a modern tree would not identify three wives, because one founder can leave many daughter lineages and some lineages die out.
The two leading young-earth writers on this subject have read the tree differently.
Jeanson, 2016:
"Going back to the time of the Flood, modern ethnic groups would have all traced their maternal ancestry back to the three wives of Noah's sons. Consistent with this historical record, three major nodes were visible in human mtDNA trees (Fig. 1)."25
Carter, 2025:
"How many lines would we expect to see? Depending on how closely related they were, there could have been 1, 2, or 3 mitochondrial lines among Noah's daughters-in-law. Thus, it is entirely possible that every mutation in the tree occurred post-Flood. The fact that there is no obvious three-way split in the tree tells us something important."3
He does not then say what it tells us. He moves to the next section. His "1, 2, or 3" is the correct reading of Genesis.
The data settle the shape. The reference phylogeny for human mitochondrial DNA is PhyloTree, and Build 17 can be parsed directly. The root node has exactly two children, L0 and L1'2'3'4'5'6. Ten mutations sit on the L0 stem and eight on the other, eighteen in total separating the two deepest branches.63 Behar's independent reconstruction gives the same bifurcation.22
The tree does not have a three-way root. That refutes Jeanson's 2016 identification of three nodes with three wives. It does not refute three wives, for the reason given above. Jeanson has since set his three-wives root aside himself. His 2025 paper says that model "puts three roots on the tree," and of it and Carter's 2008 root: "Neither of these root models is supported by as much evidence as supports the Y chromosome root position."43
Where did Jeanson's three nodes come from? His figure is an unrooted radial neighbour-joining tree of 369 sequences, with no outgroup and no bootstrap support, identified by visual inspection. An unrooted radial drawing has no root to be three-way about; the layout algorithm places dense clusters wherever the sampling puts them, and what looks like a node is a property of the picture. His three clusters are almost certainly the African L group, M, and N, and M and N are both children of L3, which sits 35 mutations deep inside the African clade rather than at the root.
The weakness shows in how the claim had to be defended. When readers pointed out an apparent fourth cluster in the published figure, ICR appended an editor's note explaining that it "should not be considered a node because the distance between it and the nearest central node is almost twice as far as that between the three central nodes."64 A structural prediction that requires adjudicating by eye which visual clusters count is not a test.
What does fail is branch length. The reason to place the wives at deep nodes is to shorten the post-Flood clock: the deepest splits would then be inherited from before the Flood rather than accumulated after it. But they must still be produced before the Flood, from Eve's one sequence. Rooting where Behar's reconstruction puts the root, the three shallowest nodes that could stand for three founding women sit at depths 10, 13 and 14, separated pairwise by 11, 23 and 24 mutations. Two founders do little better: the two stems at the root carry ten and eight.
Those differences have to accumulate in the pre-Flood period, at most 1,656 years of maternal descent. The budget at each measured rate:
| Rate | Mutations available in 1,656 years |
|---|---|
| Ancient-DNA tip calibration | 0.7 |
| Soares 2009 phylogenetic | 0.5 |
| Connell 2022 Norfolk Island pedigree | 1.6 |
| deCODE 2024 pedigree | 3.9 |
| Jeanson 2015, 25-year generations | 10.5 |
| Jeanson 2015, upper CI, 15-year generations | 21.8 |
The model needs branches of 10, 13 and 14. Only Jeanson's rate reaches them, and only at fifteen-year generations combined with the top of his confidence interval, the same extreme corner the whole argument keeps having to retreat to. At the largest direct measurement ever made, the pre-Flood budget is under four mutations. Placing the wives nearer Eve avoids this only by moving those mutations after the Flood, where the rest of this article has already priced them. With one founding line, which Carter allows, every mutation in the tree is post-Flood, as he says.
And the polytomy that does exist points the wrong way. There is a genuine star in the human mitochondrial tree: node L3 has seven children, including M and N, which between them carry essentially all non-African variation. But L3 sits 35 mutations below the root, deep inside the African clade. Under a dispersal from Babel roughly a century after the Flood, those 35 mutations must accumulate along a single maternal line in about 100 years, four generations. That is over a hundred times deCODE's raw rate, the largest direct measurement, and about twelve times even the egg study's arising rate. Placing a founder at a depth of 13 instead still leaves about 22 changes to make after the Flood.
One distinction from the nuclear genome belongs here, because it is the young-earth side's best structural point. For the nuclear genome, two founders already carry four copies of each chromosome, and those copies can differ from the start. So present differences equal initial differences plus later changes, and dividing all present differences by a mutation rate assumes that every one of them arose by mutation. That is a real distinction between models, not an explanation of the data: a founder model still has to account for the number and relationships of ancestral lineages, recombination, allele frequencies and linkage, which Adam, Eve and human genetic diversity and Population genetics take up. For mitochondrial DNA the same move means giving Eve more than one mitochondrial sequence, which What would make a young history work? prices as its own rescue.
Neanderthals and Denisovans
Most young-earth authors hold that Neanderthals were fully human descendants of Noah, and the movement's own criterion supports them: Neanderthals and modern humans interbred and produced fertile offspring. By any standard the young-earth literature itself uses, they are the same kind.
That commitment has a price, and it is measurable.
Thirty-six Neanderthal mitochondrial genomes are now available, from more than fourteen sites, sequenced by several laboratories over 25 years. In this article's panel they sit 169 to 209 substitutions from the human reference sequence; the lowest, Goyet Q57-1, has about 2% of its sites missing, and the often-quoted 206 is the Vindija specimen Green's team used. On average a Neanderthal differs from a living human in the panel by 199. Modern humans differ from each other by at most about 123. The seven Denisovan records differ from living humans by 361 on average, and the high-coverage Denisova 3 genome sits 378 from the reference. The distances the rates have to explain breaks these down by region.65
Apply Jeanson's own pedigree rate as if it were a constant rate of lasting change, with the two-branch equation, and the average human-Neanderthal pair lands at about 15,800 years, the human-Denisovan pair at about 28,500, and the Sima de los Huesos specimen at about 22,100. Those are 2.6, 4.8 and 3.7 times the entire biblical timeline. The same rate puts the average pair of living humans in this panel, 59.4 differences apart, about 4,700 years from their shared ancestor, which fits perfectly well. The clock that works for us fails for them. These are deliberately generous illustrations, and they treat each ancient specimen as if it were alive today, which gives it extra time.
Jeanson concedes the problem in print:
"With respect to the YEC timescale, current rates of mtDNA mutation are too low to explain the differences between ancient DNA samples and modern human mtDNA sequences."66
What the archaic branches require, with and without dates
Stated without any archaic date, both branches, ours included, need about 0.41 lasting changes per generation on a 6,000-year timeline. Only rates of mutations appearing reach that.
The sequences say where the human-Neanderthal common ancestor sits. Comparing every human against every Neanderthal, 1,890 pairs, the two branches from their shared ancestor measure 93.6 and 102.9 substitutions, near enough equal. So the ancestor sits about 98 mutations back on each side, roughly three times deeper than Eve.
On a 6,000-year timeline, then, both lineages have to carry about 98 mutations. That is 0.409 mutations per genome per 25-year generation, the average of 0.390 on the Neanderthal branch and 0.429 on ours. Dividing the mean pairwise distance of 199.35 by both branches and 240 generations gives nearly the same figure, 0.415. The Denisovans, at 361, need about 0.752. Now compare 0.409 against nothing but mother-to-child transmissions counted in living families.67
| rate measured in living pedigrees | per 25-year generation | shortfall |
|---|---|---|
| Connell 2022, permanent changes only | 0.0058 | 71x |
| deCODE 2024, 116,663 transmissions | 0.0703 | 5.8x |
| Jeanson 2015, the young-earth clock | 0.158 | 2.6x |
| Wei 2019, new heteroplasmies above 1% | 0.313 | 1.3x |
| Arbeithuber 2025, human oocytes | 0.743 | none: it exceeds the requirement |
That version needs no Neanderthal date, no radiocarbon, no ape calibration, and no assumption about when Neanderthals died out. It compares a branch length against transmissions in living families, and a reader who rejects every archaic date still has to answer it. It does assume that all the differences arose after the shared ancestor, rather than being inherited as distinct starting sequences.
Read the bottom two rows carefully, because they are the whole article in one table. The archaic gap closes completely if a rate of mutations appearing is accepted as a rate of mutations staying. It stays open seventyfold against the one rate of permanent change that has been measured directly. The Neanderthal problem and the mitochondrial Eve problem are not two problems. They are the same joint, measured on a longer branch.
Once dates are added, a branch length is not a yearly rate. A Neanderthal's branch stops when that individual died, while ours runs to the present. For a shared ancestor T years ago and a specimen that died d years ago:
Neanderthal / human yearly-rate ratio = branch-count ratio x T / (T - d)Equal branches over 4,000 and 6,000 years imply a Neanderthal yearly rate 1.5 times ours. So equal counts do not rule out a modest Neanderthal speed-up on a short chronology. A more recent shared ancestor, or an older specimen, raises the requirement. With the measured branch counts and 25-year generations, the requirements under several assumed dates are:67
| Shared ancestor, years ago | Specimen died, years ago | Neanderthal branch duration | Human changes per genome per generation | Neanderthal changes per genome per generation |
|---|---|---|---|---|
| 6,000 | 0, for comparison | 6,000 years | 0.429 | 0.390 |
| 6,000 | 2,000 | 4,000 years | 0.429 | 0.585 |
| 6,000 | 3,000 | 3,000 years | 0.429 | 0.780 |
| 4,500 | 2,000 | 2,500 years | 0.572 | 0.936 |
| 4,500 | 3,000 | 1,500 years | 0.572 | 1.561 |
These are conditional requirements, not dates anyone has inferred. The date when the last Neanderthal died cannot be given to every sequenced specimen, and no young-earth chronology assigns specimen-by-specimen dates. The same correction changes the relative-rate test below: its branch-count ratio of 1.011 (95% interval 0.754 to 1.356) becomes, with a 6,000-year ancestor and a specimen 2,000 years old, a yearly ratio of 1.517 (1.131 to 2.035). On that scenario the data actually suggest a moderately faster Neanderthal rate per year. These intervals hold the dates, the assigned changes and a simple site model fixed, and leave out recurrent mutation, selection, alignment and shared ancestry, so they are sensitivity tests, not a measured Neanderthal germline rate.
What remains is an absolute-rate problem on both branches. In the 6,000/2,000 scenario the branches need about 0.43 and 0.59 lasting changes per generation. A modest Neanderthal speed-up is easy to grant. A seventyfold speed-up on the human branch, which runs to the present and was sampled in living families, is not.
Three escapes have been tried.
Escape one: the sequences are degradation artifacts
This is the older young-earth position and it has a serious paper behind it. Daniel Criswell, a molecular biologist then at the Institute for Creation Research, worked it out in detail in 2009.68 His case has three parts, and the middle one is a real statistical test that can be repeated.
His test. Post-mortem damage is not random with respect to base. Cytosine deaminates to uracil, which sequences as thymine, so decay produces an excess of one particular class of change. Criswell labelled C→T and G→A Type 2, the damage signature, and T→C and A→G Type 1. If the Neanderthal differences are decay rather than inheritance, Neanderthal sequences should carry more Type 2 changes than modern humans do. He aligned nine Neanderthal hypervariable-region-1 sequences against a modern human consensus and found 16 Type 1 against 24 Type 2, where modern humans gave 128 against 104. His chi-square was 3.7. He reported the result honestly: it is "barely outside of the 0.05 standard but cannot be dismissed as being insignificant."68
Repeated on thirty-six genomes, it does not hold. Criswell had nine sequences of about 360 base pairs each, PCR-amplified, from before enzymatic damage removal was standard. Thirty-six complete Neanderthal genomes are now available. Running his own test on them gives 6,173 transitions against his 40: 154 times the data.
| Region | Type 2 share, modern humans | Type 2 share, Neanderthals | Chi-square |
|---|---|---|---|
| HVR1: Criswell's own window | 46.0% | 46.0% | 0.0 |
| Control region | 49.0% | 47.3% | 0.4 |
| Coding region | 52.0% | 54.8% | 3.0 |
| Whole molecule | 51.2% | 53.6% | 3.0 |
His control replicates and his result does not. His modern-human baseline was 44.8% Type 2 in HVR1, derived from more than 4,300 sequences. The panel used here gives 46.0%, from different sequences by a different method: an independent confirmation that his measurement of normal human variation was sound. But in that same window the thirty-six Neanderthals also give 46.0%, identical to humans, where he had found 60%. His 60% was 24 successes out of 40, which sits 1.8 standard errors from 46% and carries a one-sided binomial probability of 0.053. That is small-sample noise, and it is the same 0.053 he reported and declined to lean on. Across the whole molecule a residual 2.4-point gap survives, but the chi-square is 3.0 against a 3.84 threshold: on 154 times his data. An effect that does not grow when the sample grows 154-fold is not there. In the control region it runs backwards.
The polarised spectrum is where the test finally breaks. Deamination is directional: it turns C into T, not T into C, so counting the two directions separately should be sharper than any ratio. It is, and it exposes why Criswell's method could never have worked, because living mitochondria deaminate too. Human mitochondrial DNA is copied by a strand-displacement mechanism that leaves one parental strand single-stranded for a long time, and cytosine in single-stranded DNA deaminates far faster than in double-stranded DNA. The result is that the normal, inherited mutational spectrum of mitochondrial DNA is already a deamination spectrum. Scott Sanchez-Contreras and colleagues measured it directly and found the signature written across the molecule as a gradient: "these patterns support genome replication via a deamination prone asymmetric strand-displacement mechanism as the fundamental driver of mutagenesis," and the same gradient appears in inherited human polymorphisms.69
That signature has a specific shape. Because the reference sequence is the cytosine-rich light strand, deamination on the displaced heavy strand shows up in reference coordinates as G→A and T→C. The modern human data here carries it plainly: G→A runs 1.35 times A→G, and T→C runs ahead of C→T.
So Criswell's categories cannot separate the two hypotheses. Dead mitochondria and living mitochondria deaminate by the same chemistry. Worse, his Type 1 and Type 2 classes each capture one arm of the living signature, T→C sits in Type 1, G→A sits in Type 2, so the very asymmetry that identifies normal mitochondrial mutation is split across both of his categories and cancels. The test was diluted by construction, which is the likeliest reason it returned a marginal result on his data and nothing at all on 154 times as much.
What post-mortem damage predicts that living deamination does not is both arms moving together. Ancient libraries are built double-stranded, so post-mortem C→U appears as C→T and G→A at once. Comparing the archaic differences against modern human ones:
| C→T vs T→C | G→A vs A→G | |
|---|---|---|
| Modern humans | 0.85 | 1.35 |
| Neanderthals | 1.28 | 1.03 |
C→T rises. G→A does not: it falls. One arm moves and the other moves the wrong way, which is not what a damage signature looks like.
Two things must be said against over-reading even this. The two comparisons sit at very different depths, about 30 differences per genome against about 199, and deeper comparisons drift toward the molecule's equilibrium composition, so the ratios are not strictly like for like. And a real residue of damage in some libraries is not in dispute; it is measured per library, and it gets samples thrown out. The claim here is narrower: the archaic gap does not carry the two-armed signature that post-mortem deamination would leave.
The transversion check, which no version of this argument can reach. Deamination cannot produce a transversion at all, by any route, living or dead: a purine cannot become a pyrimidine by losing an amine group. Counting transversions only, Neanderthals still sit 2.8 times and Denisovans 4.9 times further from modern humans than modern humans sit from each other. That number is immune to every consideration above.
Criswell's other two arguments. He found a three-thymine insertion in one 1999 Neanderthal sequence, in a conserved block where no modern human and no primate carries one, and argued it must be an artifact. He is very likely right that it is. But he identifies its location himself: the poly-cytosine tract at position 309, which he calls the most variable site in the entire human mitochondrial genome.68 Every count in this article already excludes that tract along with the other two known length polymorphisms, so the trimer contributes exactly nothing to the 199 substitutions being explained.
His third argument is that DNA cannot survive long enough: citing a calculation that fragments under 400 base pairs last no more than about 10,000 years in temperate conditions. That ceiling has since been overtaken by direct recovery: mammoth genomes from permafrost dated to 1.2 to 1.1 million years, and environmental DNA from Greenland sediments at roughly 2 million.70
What is left of the escape? Criswell was reasoning in 2009 from nine short PCR fragments produced before enzymatic damage removal was routine, and caution was the right posture for that evidence. The evidence changed. Damage is real, it is measured per library, it disqualifies samples, and the residue does not look like decay by the test the argument's own advocate chose. Nor can damage explain the shape of the result: it is random per specimen, so noisy sequences would scatter, and instead thirty-six specimens from fourteen sites cluster tightly together and fall consistently outside modern variation.
Escape two: the Neanderthal lineage mutated faster
This is the current Answers in Genesis position. Marshall Jordan stated it in 2024 and extended it from the Y chromosome to the mitochondria71: "If sequencing errors did not cause the excessive number of Neanderthal Y chromosome variant alleles, the only other option is hypermutation… Perhaps the great divergence of the Neanderthal mitochondrial genome from moderns is also due to hypermutation."71
The escape can be priced, and it has been checked four ways.
First, how much faster would it have to be? The section above gives the answer, and it is not the one the escape is usually aimed at. Relative to us, a Neanderthal lineage on a short chronology needs to have run only about 1.4 to 2.7 times faster per year, depending on when each specimen died and when the shared ancestor lived. In absolute terms both lineages, ours included, need about 0.4 lasting changes per generation or more. A hypermutating Neanderthal lineage does nothing for the human branch.
Second, how much does the rate actually vary from one human lineage to another? That is the measurable form of the question, and it has been answered. Sanni Översti and Jukka Palo tip-calibrated four sublineages of haplogroup U against 234 radiocarbon-dated ancient genomes, a direct test of whether two branches of the same tree tick at the same speed. The largest gap they found: "the rates for U2 and U5a are 2.1 and 1.9 times higher than for U5b, respectively." Their own next sentence: "the 95% highest posterior density (HPD) intervals are largely overlapping suggesting non-significant differences between values."59
Two other measurements bracket the same question, and both land lower. Brenna Henn's team estimated coding-region rates separately for five Oceanic and Australian lineages, each calibrated on an archaeological settlement date, and got 0.0265 to 0.0401 substitutions per base per million years, a 1.5-fold spread, which they described as "a slight 'uptick' or small increase."40 And Adrien Rieux's team took 21 radiocarbon-dated ancient genomes and used each one alone as the sole calibration point. The 21 answers had a coefficient of variation of 3.2% and a high-to-low ratio of 1.11, across samples ranging from 2,535 to 39,464 years old, though, as noted above, the runs share one tree and model.32
| what was compared | spread | the authors' own verdict |
|---|---|---|
| Rieux 2014, 21 ancient genomes, each the sole calibration | 1.11x | all intervals overlap |
| Henn 2009, 5 Oceanic lineage rates | 1.5x | "a slight uptick or small increase" |
| Översti & Palo 2022, haplogroup U sublineages | 2.1x | "non-significant differences" |
| Neanderthal yearly rate on a short chronology, from the branch counts | 1.4x to 2.7x | depends on the assumed dates |
One correction to that table, and it goes against this article's own earlier statement of the case. The three published comparisons above are the ones usually quoted, but this article has its own dataset that bears on the question, the 229 radiocarbon-dated haplogroup U genomes used further down, and it was never asked. Asking it changes the answer. Fit each subclade its own slope rather than one slope shared across all four, and the four rates differ significantly: F(3,220) = 5.64, p = 0.001, with U2 running about 3.2 times U5b.60 The rank order independently reproduces Översti and Palo's, so this is a replication of their direction with a formal test they did not run.
Print the fragility with it. The rejection is carried entirely by U2, the one subclade with samples older than 26,000 years. Drop U2 and the test gives p = 0.31; restrict to the Holocene and p = 0.28; compare U5a against U5b alone and p = 0.17. So this is not a clean measurement of a threefold difference, it is a rejection of exact homogeneity plus a point estimate that could easily be noise.
So there is no flat twofold ceiling, and this article previously said there was. Human lineages differ by up to about threefold in this dataset, and none of these studies establishes a universal limit. That matters, because the yearly speed-up a short chronology needs for Neanderthals, about 1.4 to 2.7 times, sits inside the range human lineages already show. The escape does not fail on relative rate. It fails on absolute rate, as the opening of this section showed: both branches need about 0.4 lasting changes per generation, and the human branch was measured in living families at a seventieth of that. The direct test below measures the disputed branch itself, and the argument should rest there and on the absolute requirement, not on a ceiling.
Third, and this is the direct test: what does the Neanderthal branch itself measure? The rate does not have to be inferred. Richard Green's team measured the branch when they published the first complete Neanderthal mitochondrial genome.72
"A tantalizing finding is that when all substitutions in the mtDNA are analyzed, the Neandertal mtDNA lineage is shorter than the human lineage by approximately 20%"72
Shorter. Not longer. Green's team say in the same paragraph that most of that 20% is probably noise, "for small evolutionary distances such as these, there is a large stochastic component to phylogenetic branch length", so this is not a precision measurement of a Neanderthal mutation rate, and it is not offered as one. But it is the one direct look at the disputed quantity, and it misses in the wrong direction: a branch the escape needs to be long measures 0.8 times ours.
Green had one Neanderthal genome. There are now thirty-five. The test needs no clock, no calibration and no split date. Take a sequence that branched off before both lineages, the Denisovan mitochondrial genome, which sits outside the human-Neanderthal pair, and count, position by position, which of the two lineages changed. A hypermutating Neanderthal lineage should carry the longer branch, so the two counts test it directly. This is Tajima's relative-rate test, and it was run here on consensus sequences built from 54 modern human and 35 Neanderthal genomes.73
What the test measures is worth stating plainly. It counts changes on each branch, so it measures branch length, not rate per year. The two branches have not run for the same time: the human branch runs to the present, while each Neanderthal branch stopped when its specimen died. Turning a branch ratio into a ratio of yearly rates needs both durations, and those are the dates in dispute. The count tests branch length directly, and the test can fail. As a test of yearly rate it is conditional on when the specimens lived, and the conversion above shows how much that matters.
| outgroup, region | Neanderthal branch | human branch | ratio | 95% CI |
|---|---|---|---|---|
| Denisovan, whole molecule | 89 | 88 | 1.01x | 0.75 – 1.36 |
| Denisovan, coding region | 68 | 79 | 0.86x | 0.62 – 1.19 |
| Denisovan, control region | 21 | 9 | 2.33x | 1.09 – 5.00 |
| chimpanzee, whole molecule | 82 | 95 | 0.86x | 0.64 – 1.16 |
| chimpanzee, control region | 16 | 15 | 1.07x | 0.53 – 2.13 |
And it could have failed, which is the point. There were 177 informative changes. Had the Neanderthal branch been twice as long as ours, about 118 of them should have landed on the Neanderthal side. Eighty-nine did.
| if the true branch-length ratio were | expected Neanderthal share of 177 | probability of seeing 89 or fewer |
|---|---|---|
| 1.0 | 88.5 | 0.56 |
| 1.36 (the upper confidence bound) | 102.0 | 0.029 |
| 1.5 | 106.2 | 0.0055 |
| 2.0 | 118.0 | 5 × 10⁻⁶ |
| 3.0 | 132.8 | 1 × 10-12 |
A Neanderthal branch even one and a half times as long as ours would very likely have been detected. It was looked for and it is not there. Three separate outgroups at three different depths were used, a Denisovan, a chimpanzee, and the Sima de los Huesos specimen, giving 1.01, 0.86 and 1.06. A wrong tree shape would make them disagree.
Two caveats, and both favour the escape rather than this article. Neanderthal branches stop when the specimen died while ours run to the present, so equal counts imply a somewhat faster Neanderthal rate per year: about 1.5 times, with an interval of 1.13 to 2.04, for a 6,000-year ancestor and specimens 2,000 years old. And at about 98 changes per branch a genuinely fast lineage would strike some positions twice and undercount itself, biasing the measured ratio toward equality. Neither caveat touches the absolute requirement on the human branch.
Dropping each of the 35 Neanderthals in turn moves the whole-molecule ratio only between 1.011 and 1.023. Taking every human and every Neanderthal as a separate pair, 1,890 comparisons, the Neanderthal branch averages 93.6 against the human 102.9, and the Neanderthal branch is the longer one in 8% of pairs. Not one of the 35 specimens is significantly faster than the human branch, and not one is significantly slower.
At 95% confidence the Neanderthal branch is no more than 1.36 times as long as ours. That is a ceiling on branch length, not on yearly rate, and as a yearly rate it depends on when the specimens lived. Granting the full 1.36 does not rescue the human branch: rerun the split arithmetic at Jeanson's own pedigree rate with the whole permitted asymmetry applied, and the human-Neanderthal date moves from 15,800 years only to about 13,400: still more than twice the entire biblical timeline. That figure needs no Neanderthal date, because it rests on the human branch, which runs to the present.
One row of that table runs the other way. With the Denisovan as outgroup the Neanderthal control region measures 2.33 times ours, and the ordinary test calls that significant. It does not survive inspection. Use the single high-coverage Denisova 3 genome alone rather than a consensus over all seven Denisovan records and it falls to 1.50 with a p-value of 0.27. The significance came entirely from three low-coverage Denisovan records whose D-loops carry the same reference bias documented for the Sima specimen. It does not replicate at all with a chimpanzee outgroup. Thirty informative positions decide it, all in the most saturated 7% of the molecule, and six tests were run in that panel.
And the same test on the Denisovan lineage is the cleaner result. If the archaic condition itself, small isolated bands, ice-age Europe, poor nutrition, inbreeding, were what raised the mutation rate, Denisovans should show it too, and more strongly, because their distance from us is nearly twice the Neanderthals' and needs about 0.75 lasting changes per generation on each branch rather than 0.41. With chimpanzee as the outgroup the Denisovan branch measures 0.96 of the human branch on the whole molecule and 0.93 on the coding region. Two archaic lineages, two continents, both with branches no longer than ours.
There is a further check from outside the mitochondrion entirely. When Matthias Meyer's team published the high-coverage Denisovan nuclear genome they compared substitution counts along three billion base pairs: "the number for the Denisovan genome is 1.16% lower (1.13 to 1.27%)… the shortening of the Denisovan branch allows the bone to be tentatively dated to between 74,000 and 82,000 years before present, in general agreement with the archaeological dates."74 The archaic branch is shorter, by an amount that converts into a physically sensible date. A hypermutating archaic lineage would make it longer.
Fourth, the internal-diversity test. Stefan Frello, a Danish biologist who published his critique inside the creationist journal itself, found a contradiction the hypothesis has to face. A lineage that mutates faster becomes more diverse inside itself too, because the same raised rate runs within the group as well as on the branch leading to it. There is no way to switch it on for one and off for the other. Frello's own figures: living humans differ by at most about 120, humans and Neanderthals by 180 to 240, and Neanderthals among themselves by at most about 80.75
| Lineage | Average internal difference in this panel |
|---|---|
| Neanderthal | 31.5 |
| Denisovan | 42.8 |
| Modern humans, for scale | 59.4 |
Even the modest yearly speed-up a short chronology needs, 1.4 to 2.7 times ours, predicts a Neanderthal lineage at least as varied as ours. It is about half as varied. This is a weaker test than it first looks, though, because a small, inbred, short-lived population has low diversity for reasons that have nothing to do with its mutation rate, and that is the point of Jeanson's reply.
Jeanson's published reply to Frello is the best answer on offer, and it is honest about what it does:
"The problem with Frello's argument is that he implicitly assumes a particular genealogical relationship among the Neanderthal individuals… If Neanderthals are genealogically-related descendants of post-Babel peoples… then almost by definition the Neanderthal sequences will be closer to one another than any are to modern human sequences."66
That is fair as far as it goes. A closely related set of individuals is of course internally similar. But it relocates the difficulty instead of removing it. The roughly 98 changes on the Neanderthal side still have to accumulate somewhere. If they accumulated on the shared stem before the Neanderthal common ancestor, then the stem ran fast for a handful of generations and then stopped, precisely at that ancestor, in a lineage whose descendants then spread across two continents without it ever restarting. And the human branch, which has no such stem, still needs its own 98.
The exchange ran two further rounds and neither closes it. Frello dropped the technical argument and told Jeanson to take the case to mainstream journals instead, "Confront them, Dr. Jeanson!", and Jeanson read the withdrawal as a concession.76 Nobody returned to the numbers.
The pre-Flood version is worse, not better. Some writers place Neanderthal mitochondrial DNA before the Flood, as antediluvians or as a line entering through one of Noah's daughters-in-law. That cuts the available time to Creation-to-Flood, 1,656 years, which at Jeanson's own rate yields about 21 differences. The observed figure is 199. And because mitochondrial DNA passes through one parent and does not recombine, the created-heterozygosity escape used elsewhere in young-earth genetics is available only in one form: Eve herself would have to have carried more than one mitochondrial sequence. What would make a young history work? prices that model.
What mechanism could actually do it?
Three have been proposed. One is dead on arrival, one is untestable, and one is good enough to deserve real numbers. A fourth is added here, because it is the best environmental candidate anyone could name and nobody on either side has named it.
Patriarchal drive is dead on arrival. Jordan's first candidate is that older fathers pass on more mutations, and the longest-lived fathers in history lived just after the Flood.77 The effect is real, and it is entirely paternal. Mitochondrial DNA comes from the egg, and a woman's eggs stop dividing before she is born. The point is not one a critic has to supply, because Jeanson states it himself in a footnote to his own generation-time paper: "male generation times are virtually irrelevant since mtDNA lineages stop with the men who inherit them."25 One qualification, because the sentence about eggs is easy to over-read: oocytes stop dividing before birth, but they do not stop accumulating. Mitochondrial heteroplasmies rise measurably with a mother's age, and that maternal version of the argument is far stronger than the paternal one. It is ranked and priced below.
Harsh conditions weakening DNA repair is untestable as stated. Robert Carter, in the fullest young-earth treatment of this question in print,78 suggests that Neanderthals in post-Flood Ice Age Europe suffered vitamin D deficiency and poor nutrition, and that a starved body shuts down non-essential systems including DNA repair: "Add a harsh environment and poor nutrition to a small inbreeding population and you have an instant recipe for the rapid accumulation of mutations in any human population."78 No number is attached, and no measurement of nutrition raising the human germline mitochondrial mutation rate exists. It is also awkward for the shape of the data: Neanderthals from Siberia, Spain and the Rhineland lived under very different conditions and all sit the same distance from us.
High altitude is the fourth, and it is not made in the literature at all. Denisovans occupied Baishiya Karst Cave on the northeastern Tibetan Plateau, 3,280 metres above sea level, from at least 160,000 years ago.79 Cosmic radiation climbs steeply with elevation and ionising radiation is a mutagen. If any hominin population had a physical reason to mutate faster, this is the one. The dose can be computed rather than guessed, and Kerala supplies a measured control at a much larger dose.80
| Where | Elevation | Cosmic dose per year | Total natural dose per year | Against baseline |
|---|---|---|---|---|
| Germany, Forster's baseline | lowland | — | 1,100 µSv | 1.0x |
| Denisova Cave, Altai | ~700 m | 340 µSv | ~1,100 µSv | ~1.0x |
| Baishiya Karst Cave, Tibet | 3,280 m | 1,580 µSv | ~2,300 µSv | ~2.1x |
| Kerala monazite coast | sea level | 350 µSv | 10,000-12,000 µSv | ~10x |
Four things sink it, and the last two are specific to Denisovans.
The control has already been run at eight times the dose, and it moved nothing that counts. Kerala's excess is about +9,000 µSv per year against altitude's +1,200. At that much larger dose Forster's families produced 22 new heteroplasmies in 595 transmissions against 1 in 200, a 7.4-fold rise in mutations appearing, and not one of them was fixed.81 A clock runs on the fixing rate. Forster also found that the 22 affected positions "mutate, on average, 12 times faster during evolution," so what radiation amplifies is the hypervariable hotspots, and those are the sites that contribute least to phylogenetic distance because they saturate.
The mechanism is the wrong one. The only altitude-specific route to mitochondrial mutation anyone could propose is thin air, then reactive oxygen species, then oxidative damage. That is not what drives the mitochondrial spectrum. Duplex Sequencing of human brain mitochondrial DNA across an eighty-year age span found the opposite: "G→T mutations, considered the hallmark of oxidative damage to DNA, do not significantly increase with age."82 The spectrum is transitions, from polymerase errors and spontaneous deamination. The pathway altitude would have to act through is the one that turns out not to be doing the work.
The divergent sequences do not come from altitude. The roughly 361 substitutions that separate Denisovans from us were read from specimens in Denisova Cave in the Altai, about 700 metres up, ordinary hill country, which the table above puts at the baseline dose. Every scrap of Denisovan material from 3,280 metres is either sedimentary mitochondrial DNA or ancient protein: the Xiahe mandible and the Xiahe rib were identified by palaeoproteomics, not by DNA, and the high-altitude mitochondrial sequences were recovered from cave sediment.83 No high-altitude Denisovan contributes branch length to the phylogeny at all.
And the branch was measured before the question was asked. Whatever Denisovans experienced, the relative-rate test above puts their mitochondrial branch at 0.96 of the human branch against a chimpanzee outgroup, and Meyer's team found their nuclear branch 1.16% shorter than ours.74 A lineage mutating fast enough to matter should carry the longer branch. The measurement is one.
What should be conceded is the premise, which is solid. Denisovans really did live at 3,280 metres for something like a hundred thousand years, and the EPAS1 variant that lets Tibetans thrive up there came from them. That is good evidence and it is theirs. It just does not touch the clock. There is also an awkwardness for anyone wanting to use it: the sedimentary mitochondrial DNA that establishes Denisovans at altitude is the same evidence that dates them to 160,000-45,000 years ago.
The best mechanism on offer is a defective DNA polymerase, and it can be priced. Carter states it precisely, and it is the sharpest paragraph in the young-earth literature on this question:
"Neutral theory does not allow for mutations in DNA polymerase or in anything that affects DNA copying or repair to occur in only a single subpopulation. That would destroy the very notion of a molecular clock… But we can measure the fidelity of DNA polymerases including the human mitochondrial DNA polymerase, and we know that mutations in DNA polymerases can elevate error rates in human mitochondria."78
He is right that this is measurable, and it has been measured, in exactly the system he names. Aleksandra Trifunovic's team built mice carrying a proofreading-deficient version of PolgA, the catalytic subunit of the mitochondrial DNA polymerase.84 Switching off proofreading altogether produced "a threefold to fivefold increase in the levels of point mutations."84
Three to five times is a somatic figure, measured in the tissues of the mice themselves, and it understates what the same defect does in the germline. The germline count is far larger, and it is the young-earth side's best mechanism number. James Stewart's team bred mutator females for a few generations and then sequenced the whole mitochondrial genome of 190 descendants: "The typical animal carried approximately 30 mtDNA mutations (mean = 29.8 mutations, standard deviation = 9.2). In each line, a large proportion of the identified mtDNA mutations (38.48%) were transmitted to the descendents of that particular N1 female."39 Every one of those was scored at 25% of the copies or more, and those mutations were made in the germlines of at most three mutator-carrying females in a row.
Priced with the article's own rule, that a neutral variant at frequency f eventually takes over a followed lineage with probability f, 30 mutations at 25% or more come to roughly 2.5 to 7.5 lasting changes per mutator generation, depending on how many of the three generations made them. At that pace the whole 57.1-change depth of the human tree could be produced in about 8 to 23 generations, 200 to 600 years. That is the same order as the burst a young history needs, and about a hundred times what "three to five times" suggests.85 So a known nuclear defect is big enough. This shows the mechanism exists at the right size. It is not evidence that it ever operated in humans, and it carries a heavy price: inherited mutator mutations aggravate ageing in mice and lead to falling fertility over the generations,86 the defect would have to run in every surviving maternal line, Neanderthal and Denisovan included, at once, and then vanish from every population without leaving the allele behind. What would make a young history work? ranks it as a rescue. For Neanderthals in particular it is more than enough, since the relative speed-up a short chronology needs is 1.4 to 2.7 times; what it cannot explain is why the Neanderthal branch measures no longer than ours.
And the gene itself can be read
Carter's challenge was the right one, and it can now be answered a second way. Three Neanderthal exomes and one 52-fold Neanderthal genome have been public for over a decade. If Neanderthals carried a broken copying or repair gene, it is sitting in a file on a public server. Nobody on either side has looked.
Searched here: a 206-gene panel covering mitochondrial DNA replication and maintenance, base-excision repair, the pathway that actually operates on mitochondrial DNA, nucleotide-excision repair, mismatch repair, double-strand-break repair, the progeroid helicases including the Werner gene Jordan names, Fanconi anaemia, the replicative polymerases, and translesion synthesis. Two independent passes: the published catalogue of every amino-acid change fixed on the Neanderthal lineage,87 and a residue-by-residue comparison of all three Neanderthal exome proteins against the human reference, which catches the heterozygotes and single-individual variants a fixed-difference catalogue drops.88
Three findings came back, and the first two are negative.
No gene in the panel is broken, in Neanderthals or in modern humans. Not one premature stop codon, lost stop codon or destroyed splice site, on the Neanderthal lineage, the shared archaic lineage or the modern human lineage. That zero is informative rather than an artifact of filtering: the same catalogues contain 47 Neanderthal-specific, 19 archaic-specific and 29 modern-human-specific changes of exactly those classes elsewhere in the genome. The repair machinery simply has none.
The panel took its fair share of change and no more. The 195 panel genes the exome capture reached hold 1.32% of its coding sequence, so that is the share of lineage-specific amino-acid changes chance predicts. Neanderthals put 15 of their 924 there: 1.62%, P = 0.25. Modern humans put 11 of 769 there: 1.43%, P = 0.44. Between the two lineages, Fisher's exact test gives p = 0.84. And the core mitochondrial machinery is untouched outright: no amino-acid difference at all in TWNK, MGME1, SSBP1, TFAM, TOP3A, LIG3, OGG1, UNG or NEIL1, in genes covered at 80 to 97% of residues.
And one variant that the young-earth side should be told about, because it is the best thing this position has ever had. It is in POLG itself: Carter's own gene, the catalytic subunit that Trifunovic's mice have a broken copy of.
At GRCh37 chr15:89,868,891 the Altai Neanderthal carries two copies of a derived change, leucine to proline at residue 580, on 39 reads with the highest possible genotype quality. The Vindija Neanderthal carries one copy. The Denisovan and all nine present-day human exomes in the same file carry the ancestral allele, as do chimpanzee, gorilla and orangutan. Five things make it more than noise:
- Almost no living person has it. The allele appears in gnomAD at 6.9 × 10⁻⁷: roughly one chromosome in one and a half million.
- The position is conserved. 99.2% of mammals carry leucine there; GERP 4.99.
- It sits beside working parts. Residue 579 is an annotated RNA-primer contact, and residue 580 lies in the part of the spacer that forms the channel holding the DNA.89 Natural variants recorded nearby cause disease: R574W and R579W cause progressive external ophthalmoplegia, and P587L causes that and mitochondrial DNA depletion syndrome.90
- The substitute is proline, the residue most likely to kink a protein backbone.
- It cannot be decay. Post-mortem deamination makes C→T and G→A only. This is A→G, the opposite direction, homozygous at 39-fold coverage with reads balanced across both strands.
Carter said the fidelity of the mitochondrial polymerase is measurable and that mutations in it can raise error rates. He was right, and closer to something real than he knew.
What it does not show is equally specific, and an earlier version of this article overstated four of the reasons against it.
Its location does not rule out an effect on copying accuracy. Proofreading in POLG is the 3′→5′ exonuclease, whose active site is aspartate 198 and whose motifs run from residue 196 to 403, and that is what Trifunovic's mice have disabled. Residue 580 lies outside it, in the spacer. But a survey that mapped 136 disease mutations of this enzyme onto its structure found working modules well beyond the catalytic sites, including a cluster in exactly this stretch, residues 561 to 617, whose changes are predicted to weaken the enzyme's grip on DNA, and it found changes far from the exonuclease that lower copying accuracy directly.89 89 Binding, movement and the balance between copying and proofreading can all affect fidelity.
POLG variants are not uniformly recessive. Some cause late-onset disease in a single dose, so Vindija's one copy cannot be assumed to do nothing.89
The neighbouring disease variants do not fix this one's effect. R574W, R579W and P587L cause mitochondrial DNA depletion and deletions, cells short of mitochondrial DNA or carrying copies with pieces missing. Depletion, deletions and point-mutation fidelity are different outcomes that need separate measurements, and no measurement of Leu580Pro exists.
And the branch length cannot isolate one person's nuclear variant. POLG is inherited from both parents, while mitochondrial DNA follows the maternal line, and a carrier's mitochondrial branch includes every change made before that carrier existed. So the Neanderthal branch's measured length, 1.01 times ours, limits how much extra change the whole lineage gathered; it cannot say what this allele did in the generations that carried it.
What still limits it is real. It is not fixed in Neanderthals: Altai has two copies and Vindija one, and the Altai individual's parents were half-siblings, which is the ordinary explanation for a rare variant turning up in double dose. The Denisovan is ancestral at the site, so it cannot explain the Denisovan distance. And no laboratory has measured what it does. It is a candidate worth testing, not a mechanism shown to raise the mutation rate.
The honest position is that this variant deserves an experiment rather than a prediction. Yeast carries an equivalent gene, MIP1, and a Parma group has already built a yeast assay for testing archaic mitochondrial variants; they used it to show that an archaic YARS2 variant reduces respiratory activity.91 Until somebody puts POLG Leu580Pro through it, or through a purified-enzyme test, "possibly damaging" is a computer's guess.
What can be checked without a laboratory?
Some of the work can be done from data already public, and each check has a limit:
| Check | What it can establish | What it cannot establish |
|---|---|---|
| Inspect the ancient reads and independent call sets | Whether Leu580Pro is well supported in each specimen | The protein's function |
| Inspect sequence conservation and a protein structure | Whether the change plausibly disturbs a contact or local structure | How much it raises the mutation rate |
| Compare variant-effect predictors | Whether different models flag a possible effect | Whether the effect is lower fidelity, depletion or something else |
| Search existing functional datasets | Whether someone has already measured the variant | That an unmeasured result is negative |
| Compare carriers and non-carriers, if enough data exist | An association, after accounting for ancestry, sample age and other variants | A clean causal effect from a few related ancient genomes |
The POLG Foundation describes a funded Broad Institute project to map coding variants of the gene to mitochondrial respiratory function. The page states an aim, not a released measurement of Leu580Pro, and no published functional result for it has been found.92 Even a respiratory-function score would not measure copying accuracy directly. A purified-enzyme assay can: Yufeng Qian's team measured polymerization and fidelity separately for two disease mutations of the human enzyme in a reconstructed system.93 Yeast offers another route, through MIP1, and has been used to test patient variants of the human gene,94 though a yeast result does not carry over to human germline transmission by itself. A matched experiment should measure the enzyme's error rate and proofreading with and without Leu580Pro, and then a transmission model would still be needed to turn a fidelity effect into lasting mitochondrial differences.
The Denisovan genome has no repair defect
The Denisovan, which needs the most, has the least. Denisovans sit about 361 substitutions from living humans rather than 199, so on a 6,000-year timeline each branch needs about 0.75 lasting changes per generation, nearly twice the Neanderthal requirement. The same panel was run on the Denisova 3 genome, and raw it looks like a much richer harvest: 178 distinct variants and four loss-of-function calls where the Neanderthal lineage had none. Three signatures identify almost all of it as artifact.95
- The rare calls carry the damage signature. Post-mortem deamination makes C→T and G→A and nothing else. Among variants rare or absent in living people, the Denisovan-specific candidates, C→T plus G→A account for 50.0%. Among variants common in living people, which are shared polymorphism by construction and serve as the null, they account for 28.2%.
- And they are heterozygous. Damage hits one strand in one read family, so it surfaces het; real fixed differences surface homozygous. The rare set is 64% heterozygous against the common set's 14%, at the same sequencing depth. Of the fifteen damaging-and-rare hits, ten are heterozygous C→T or G→A: the damage profile exactly.
- One gene supplies the loss-of-function calls, and it is a mismapping trap. PRIM2 alone carries 14 of the rare variants and three of the four loss-of-function calls, all heterozygous, all within 69 kb. It sits in a segmental duplication with a known paralogue. It is also the nuclear primase, mitochondrial primers are made by POLRMT, so even a real null allele there could not touch the mtDNA rate.
Re-genotyped in a second, independent call set, none of it survives. The eight damaging candidates in mitochondria-relevant pathways were checked in the combined exome VCF, which carries three Neanderthals, the Denisovan and nine present-day humans in one deamination-filtered file. Seven of the eight sites are not polymorphic there at all, no alternate allele in any of the thirteen samples, and every covered archaic and modern sample carries the ancestral base. The one site that is polymorphic, in LIG1, is a G→A heterozygote at 13-fold coverage in the Denisovan while both covered Neanderthals are ancestral at 45- and 20-fold. One caveat stated plainly: the Denisovan exome has no coverage at seven of those eight positions, so that file cannot refute them directly. What it shows is that nothing corroborates them.
And the pathways are wrong regardless. Mitochondria run base-excision repair and their own replication and maintenance set. They have no nucleotide-excision repair and no mismatch repair. A damaged ERCC6, XRCC3, BRCA2, FANCA or SLX4 allele cannot change the mitochondrial mutation rate whatever it does in the nucleus, which removes most of the damaging list before any artifact argument is needed.
What is left is a clean core. Nineteen genes set mitochondrial replication fidelity or repair mitochondrial lesions: POLG, POLG2, TWNK, TFAM, SSBP1, MGME1, POLRMT, TEFM, DNA2, RNASEH1, MTERF1, PRIMPOL, LIG3, OGG1, UNG, NEIL1, MUTYH, APEX1 and POLB. Across their 57,731 coding bases the Denisovan carries 13 protein-changing variants, and every one is benign by PolyPhen and tolerated by SIFT. The highest PolyPhen score anywhere in the set is 0.414. POLG itself carries one benign Pro73Ala, and the Denisovan is ancestral at Leu580Pro: 0/0 at 21-fold coverage, where the Altai Neanderthal is homozygous derived at 39-fold.
And the negative is backed by coverage, which is what makes it mean anything. Those 57,731 coding bases are 99.9% called and 97.9% covered at tenfold or better, at a median depth in the twenties to thirties. Only five of the 13 variants are even rare enough in living people to be archaic-specific candidates; the other eight are ordinary human polymorphisms the Denisovan happens to share, one of them carried by 97% of people alive today. This is not a gene set that went unread.
So the lineage with the largest gap to explain has the cleanest copying machinery of the three archaic genomes on file, and that agrees with its branch length, which measures 0.96 of ours.
Every other candidate in the panel dissolved on inspection, and one of them is worth naming because it is Jordan's own example. The single WRN difference between Neanderthals and the human reference is rs1801195, carried by 49.6% of human chromosomes, and the ancestral allele is the one the Neanderthals have, so it is the human reference genome that is unusual there, not them. The most damaging-looking change in the whole panel, SLX4 Arg204Cys at PolyPhen 0.999, is carried by about one living person in eight. A predicted-damaging MUTYH variant turned out to be private to the Altai individual, absent from Vindija at 66-fold coverage. And the panel's headline mitochondrial hit, TEFM Asp320His, sits at a position where mammals split 54% aspartate to 42% glutamate and where two living vertebrates, the Cape golden mole and the bearded dragon, carry the Neanderthal residue outright.
Two further problems with the polymerase mechanism in general, and the first is the serious one.
PolgA is a nuclear gene. Trifunovic's paper says so in its abstract: "the nucleus-encoded catalytic subunit of mtDNA polymerase." A Neanderthal mutator allele would therefore be inherited from both parents, and the young-earth position insists that Neanderthals and modern humans interbred and produced fertile offspring. That is what makes them the same kind. A nuclear mutator would have crossed with the genes that did cross, and would not have stayed welded to the Neanderthal maternal line while leaving every neighbouring lineage untouched.
And in those same mice, the germline removes what the polymerase adds. James Stewart's team tracked maternal transmission in the mutator mice39 and found "a rapid and strong elimination of nonsynonymous changes in protein-coding genes; the hallmark of purifying selection."39 So the mechanism raises the rate at which mutations appear and the germline then strips out the protein-changing fraction: the same distinction between appearing and staying that this whole article turns on, demonstrated inside the model the argument depends on.
One category slip recurs and is worth flagging. Carter reads Green's reduced-purifying-selection result as a mutation-rate result: "The accumulation of non-synonymous mutations in important genes is evidence for a high mutation rate acting on a small population under threat of extinction."78 It is not. dN/dS is a ratio of retained protein-changing change to retained silent change, and it rises when selection weakens with the mutation rate unchanged. In the same paper the total Neanderthal branch comes out 20% shorter than ours.
Escape three: the wrong sites are being counted
This is the strongest methodological objection to everything above, and it has not been answered in print by either side.
Mitochondrial site rates are not uniform. They are wildly non-uniform. In an alignment of 54 modern human genomes built for this article, the first hypervariable region accumulates differences 8.3 times faster per base than the coding region does. A handful of positions mutate so often that they have changed independently on more than a hundred branches of the human tree. So dividing a whole-genome difference count by a single whole-genome rate is, on its face, the wrong operation, and if the archaic differences happened to sit at fast positions, the depth of the archaic split would be an artifact of the pooling.
The premise is correct. The conclusion does not follow, and the reason can be measured two ways.
Partition by region, and the problem gets worse. Inside each region, compare the human-Neanderthal distance with the human-human distance in that same region. Any region-level rate difference cancels, because both numbers come from the same sites, so the ratio says how much deeper the archaic split is than human diversity, region by region.
| Region | Sites | Human-human | Human-Neanderthal | Archaic distance ÷ human distance |
|---|---|---|---|---|
| Whole molecule | 16,537 | 59.4 | 199.3 | 3.36 |
| Coding region | 15,438 | 43.5 | 164.3 | 3.78 |
| Control region | 1,099 | 15.9 | 35.1 | 2.21 |
| HVR1 | 350 | 8.2 | 20.5 | 2.50 |
| HVR2 | 303 | 5.8 | 9.0 | 1.55 |
The coding region is 93% of the molecule and carries 82% of the archaic gap, and there the archaic split is 3.8 times as deep as human diversity, more than the pooled 3.4. Pooling the regions flatters the young-earth case rather than harming it, because the control region is saturated: it has been hit so often that the deeper human-Neanderthal comparison is compressed toward a ceiling. Take the pooling away and the flattery goes with it.
One row genuinely helps the other side and should be said out loud: in HVR2 the archaic distance is only 1.55 times the human one. It is 303 base pairs and it carries 4.5% of the gap.
Partition by measured site speed, and the gradient runs backwards. PhyloTree Build 17 records, for every position, how many independent branches of the human tree mutate there. That count is an empirical site rate, measured on humans alone, assuming nothing whatever about deep time. Sorting all the differences by it:
| PhyloTree recurrence | Sites | Share of human variation | Share of the archaic gap | Archaic distance ÷ human distance |
|---|---|---|---|---|
| 0, never mutates in the human tree | 12,657 | 2.1% | 16.9% | 27 |
| 1 branch | 1,980 | 18.8% | 20.6% | 3.7 |
| 2–5 branches | 1,502 | 39.8% | 33.7% | 2.8 |
| 6–20 branches | 344 | 24.1% | 20.8% | 2.9 |
| 21+ branches, the hotspots | 54 | 15.2% | 7.9% | 1.8 |
The slower the site class, the deeper the archaic split looks against human diversity. At the 54 hotspot positions, the ones the objection appeals to, the archaic distance is only 1.8 times the human one. But they supply 15.2% of the variation among living humans and only 7.9% of the distance to Neanderthals. That is exactly what hotspots should do. A site that changes on twenty branches of the human tree does not hold still; it generates variation within a group and cannot deliver a consistent offset between two groups. Thirty-six Neanderthals from fourteen sites do not all land 169 to 209 substitutions from the human reference because of positions that flip every few thousand years.96
Counting only positions where every scored human carries one base and every scored Neanderthal carries another, there are 72 such fixed differences. None of them is at a hotspot. Thirty-eight of the 72 are at positions that mutate on zero or one branch of the entire human tree.
Two honest caveats. That zero is partly definitional: a position that changes on twenty branches is usually variable inside each group, so it cannot register as "fixed" by this test. And PhyloTree is built from human sequences, so a position lands in the never-mutates class partly because humans do not vary there, which inflates the 27-fold ratio by an unknown amount. What survives both objections is a raw count that needs no ratio at all: 33.7 of the 199.3 average differences between a human and a Neanderthal, one sixth of the entire gap, sit at positions where PhyloTree records no mutation anywhere in the human tree. Those are the last positions in the molecule a hotspot argument can reach.
Both premises behind these three escapes are true. Human populations really do differ in mitochondrial mutation rate, and mitochondrial sites differ far more than most people realise. Neither fact rescues the argument, because the archaic gap sits at the slow sites and on the branch that measures slow.
What genuinely helps the young-earth side
Three results in this section cut for the creationist case, and none of them should be buried.
First, nobody has ever measured a Neanderthal mutation rate directly, and the field says so in print. This is the strongest legitimate point on that side of the question. Cosimo Posth's team tried, using eight radiocarbon-dated Neanderthals as tip calibrations, and the attempt failed: "BEAST runs did not converge or provided a non-realistic rate of one order of magnitude lower than observed for modern humans."97 Their reasons are good ones: late Neanderthal radiocarbon dates sit at the method's limit, and those eight specimens span only about 3,000 years, far too little depth to calibrate a tree with divergences of hundreds of thousands of years. Their conclusion was an assumption: "we thus assumed that the mtDNA mutation rate of Neanderthals would be similar to the one of modern humans." Every published Neanderthal molecular date rests on it, including the most recent, from March 2026.98 A relative-rate test does not need that assumption, which is why it is the test used above, but a critic is entitled to point out that the absolute rate has never been measured on the branch in dispute.
Second, a Neanderthal-specific rate anomaly does exist. It is the closest thing to positive support this position has. Green's team ran maximum-likelihood dN/dS across seven primates and reported: "we consistently observed the highest dN/dS on the Neandertal lineage and this value was significantly higher than background rates in all comparisons (all P < 0.01)."72 Their explanation is weaker purifying selection in a small population: Neanderthals were less able to weed out mildly harmful amino-acid changes, so more of them stuck.
That is a real, statistically significant, Neanderthal-specific difference in the rate at which mutations became permanent, and it comes with a mechanism that fits the young-earth picture of a small, isolated, post-Babel group. It is still nowhere near enough, for two reasons. It is a ratio, not a total, and the whole branch still comes out 20% short. And it is confined to one class of site. Of the 100 fixed coding differences in Green's own Table 2, 74 are silent and 26 change an amino acid. Even if all 26 sat on the Neanderthal branch, and every one was there because selection failed to remove it, that is 26 substitutions toward a Neanderthal branch of about 98.
Third, Neanderthal-scale divergence exists inside a living species. Carter has argued that modern chimpanzees can differ from each other by more than modern humans differ from a Neanderthal. That checks out. In this article's panel of 166 chimpanzees the mean pairwise mitochondrial distance is about 214, with a range up to 402, and about 46% of chimpanzee pairs differ by more than the 206 that separate the Vindija Neanderthal from the human reference.65 So mitochondrial divergence of Neanderthal magnitude demonstrably exists within a living species, and a skeptic cannot argue from that number alone that Neanderthals were a separate species or that vast time is required.
The counter is that this makes chimpanzees an equal problem for the Ark model, which needs about 214 differences generated from a single pair in 4,500 years, unless the pair carried different sequences from the start.
The one result with no young-earth answer on file
In 2014 Matthias Meyer's team dated the Sima de los Huesos specimen from its mitochondrial branch length alone to roughly 400,000 years. Independently, Arnold's team dated the deposit by luminescence and palaeomagnetism to a minimum of 427,000 ± 12,000 years.99 100
Two methods, one molecular and one physical, agreeing to within 7%. They do not share the same assumptions, though each carries its own sample-specific and model-specific uncertainty, so "independent" is the right word and "assumption-free" is not. There is no young-earth response to this in the literature.
And a point that cuts the other way. Mitochondrial DNA has twice given the wrong population history. Sima de los Huesos mitochondrial DNA is Denisovan-like while its nuclear DNA is Neanderthal. Neanderthal mitochondrial DNA is closer to ours than to Denisovan, while Neanderthal nuclear DNA is closer to Denisovan. The field's repair was to posit an African mitochondrial introgression into Neanderthals more than 270,000 years ago, a rescue hypothesis nobody has observed. Gene flow, lineage loss and incomplete sorting can all make a mitochondrial tree differ from the population tree, and they are testable with more genomes, but they are inferences, not observations. A critic of the mitochondrial clock can fairly point out that the mainstream already knows this molecule does not always track populations.
Arithmetic errors, on both sides
A reader who suspects either camp of sloppiness should be able to check it here rather than somewhere else.
Carter's unit error
Carter shows his working, which makes this checkable. His endnote for Howell 2003 reads, verbatim:3
"The calculation runs like this: 0.53–1.57e-6 µ/site/year x 16,569 sites x 30 years/generation x 2, where µ = mutation rate. They only studied the fast-mutating control region, but since approximately half of all mutations occur outside this small region, I doubled their mutation rate. The data do not allow for a more accurate estimate."
There are two operations in that formula, and the doubling is not the problem. Howell's paper measured the coding region as well as the control region, 4 mutations in 462 transmissions, 0.06 mutations per base pair per million years, and those two rates put the coding region's contribution at 0.0139 mutations per generation against the control region's 0.0160. So "approximately half of all mutations occur outside this small region" is correct, and a factor of two is a fair way to handle it.
The error is multiplying by 16,569 sites. Howell's rate is per base pair of the control region, and his methods say so: "we make the conservative assumption that there are 1,122 bp in the noncoding control region." The control region mutates about sixteen times faster per base than the coding region, again from Howell's own two figures, 0.95 against 0.06, so spreading its per-base rate across all 16,569 sites assigns control-region speed to 15,447 bases that do not have it. That alone inflates the answer 16,569 ÷ 1,122 = 14.8-fold. And the two operations collide: once the per-site rate has already been spread across the whole molecule, doubling it for the rest of the molecule counts the same bases twice.
A second factor of two sits underneath. Howell's 0.95 is a divergence rate, not a mutation rate. His Table 2 defines it in a footnote, "2 × (Mutations/control region bp/Myr)", and his methods repeat it: "The divergence rate (twice the observed mutation rate)." It has to be halved, not doubled.
Done correctly, from Howell's own two measurements: control region 4.75 × 10⁻⁷ per site per year × 1,122 bp × 30 years = 0.0160 per generation, plus coding region 3.0 × 10-8 × 15,447 bp × 30 years = 0.0139, for 0.030 mutations per whole genome per 30-year generation. Carter reports the same paper as "about 0.5 to 1.5 mutations per generation": about thirty times too high. The corrected figure is also, to two decimal places, Norfolk Island's directly measured whole-genome 0.029.5
The Madrigal conversion has the same shape and a worse denominator. Madrigal sequenced HVR-I only, 360 base pairs, a third of the control region and the fastest third of it, so multiplying by 16,569 inflates by 46-fold, and no whole-genome rate can be recovered from that segment at all. His resulting "1.2 mutations per generation" is 17 to 42 times the two whole-genome pedigree rates that have actually been measured: Norfolk Island's 0.029 and deCODE's 0.070.
The effect is visible in his own article. Two paragraphs after quoting the inflated numbers, he correctly reports Norfolk Island at 0.03 and Iceland at 0.07 per generation, notices they are far lower, concludes that "the reported 'genealogical' mtDNA mutation rates are a bit too slow for the creationists," and reaches for a new mechanism he calls "Patriarchal Drive" to close a gap that is an arithmetic artifact.3
Carter's invariance figure
Carter's widely repeated statistic that 84.1% of the mitochondrial genome is invariant is an artifact of his 827-sequence sample. At 56,434 individuals the figure is 46.9%. ICR's Larry Vardiman restated it as "more than 83 percent of the mitochondrial genome had not changed in all of human history," which is simply false.
Jeanson's mislabelled comparison
Jeanson states that he compares his prediction "to the best estimates of the mtDNA diversity among non-African people groups." Two of his three target values, Kim and Schuster's 39.8 and 39.3, are global figures, not non-African. The actual non-African values from that source are 35.4 and 34.9. The correct target is 36.3 rather than 39.2. It does not overturn his match, but the labels in the paper are wrong.
Jeanson's generation-time argument
His 2016 paper needs fifteen-year generations, inferred from United Nations data on the percentage of African women married by age 19. A marriage-age distribution is not a generation interval, and he concedes the data limitation himself. The direct measurements run the other way. Wang's team, inferring generation intervals from the mutation spectrum, found intervals for African ancestry of 26.9 ± 3.5 years against 20.1 to 21.0 for East Asian, European and South Asian populations.101 Those regional figures average both sexes, so they are not maternal intervals; the same study's average female interval over 250,000 years is 23.2 ± 3.0 years, against 30.7 for males.101 Africans have longer intervals, not shorter, and the female figure is still far from 15. Madrigal's deep-rooting genealogies use a measured female interval of 28.3 years. Nothing in the literature supports 15. Older mothers also lengthen each generation, so any comparison has to be made per year, not per birth.
The argument also requires an unbroken chain of 291 consecutive fifteen-year-old mothers since the Flood.
And the errors on the mainstream side
- Wei 2019's supplementary Table S2 lists 13 de novo control-region variants, but the rate printed on the same row requires 131. Every other row is exactly consistent with n = 1,526; this one implies n = 151. It is a dropped digit.
- Madrigal 2012's headline rate of 1.24 × 10⁻⁶ per site per year appears nowhere in the paper's own results or tables, which give 2.51 × 10⁻⁶ and 0.89 × 10⁻⁶.
- Fu 2014's supplement mis-cites Fu 2013's rate as 2.47 × 10⁻⁸ where the published value is 2.67 × 10⁻⁸.
- Rieux 2014's Table S3 lists six samples' ages in calibrated BC while labelling the column "Age (CalBP)"; every one is exactly 2,000 years off.
- Mishmar 2003 argued that mitochondrial DNA is under climate selection and, in the same paper, used a strict clock to date the tree, conceding in the final line that if selection matters, "conjectures about the timing of human migrations may need to be reassessed."
- Ingman 2000 and Mishmar 2003 publish error bars that exclude calibration uncertainty. Mishmar says so explicitly. Their real uncertainty is larger than printed.
And in the notes this article was built from
Three unit errors, all of the same family, and every one caught by a row disagreeing with itself.
- A rate of 1.14 × 10⁻⁵ entered in a "per site per year" column when it is per site per generation. It comes from Ding 2015's 63 mutations in 333 trios: 0.189 per genome per generation ÷ 16,569 sites = 1.14 × 10⁻⁵ per site per generation, which at 25 years is 4.56 × 10⁻⁷ per site per year. As written, the table made Ding's rate 877 times Rebolledo-Jaramillo's. The real ratio is 35.
- A per-genome-per-generation figure sitting in a per-site-per-million-years column. The 45,000-year Siberian femur row pairs 1.8-3.2 × 10⁻⁸ per site per year with "0.0075 to 0.0133" per site per million years. Per site per million years it should read 0.018-0.032; 0.0075 and 0.0133 are what you get from 1.8 × 10-8 × 16,569 bp × 25 years.
- A rate extrapolated across a region its study excluded. Ingman's 1.70 × 10⁻⁸ is converted to 0.00704 per generation by multiplying through 16,569 bp, but Ingman measured 15,426 bp with the D-loop deliberately left out. Over the region actually sequenced it is 0.00656.
The full arithmetic for each is set out in this article's research files. The original notes have not been altered.
The point of listing them is that this class of error is extremely easy to make in this subject and extremely hard to spot. None of the three shifts a number by more than a factor of 25, and two are invisible unless the row is recomputed, which is why the literature review beside this article states the units for every rate it lists.
Every rate measurement, in one place
Rates in this field are quoted in units that do not compare, and most of the arithmetic errors on both sides come from that. Three things have to travel with any number or it is meaningless.
Which region. The control region runs about sixteen times faster per base than the coding region, and about eight times faster than the average across the whole molecule. Separately from that, a control-region rate multiplied across all 16,569 bases instead of its own 1,122 inflates the answer roughly fifteen-fold, and that single error accounts for more of the disagreement in this dispute than any biological question does.
What was counted. A study that counts every new variant appearing in a child's blood is measuring a different quantity from one that counts variants that took over the whole cell population. The two differ by a factor of a hundred or more in the same dataset.
Per year or per generation. Both are used, and converting between them requires a generation length that studies assume rather than measure. Every per-generation figure below uses 25 years, applied to the region the study actually sequenced. Where a study measured only 360 base pairs of hypervariable sequence, the per-generation figure is per those 360 base pairs, and scaling it to the genome is not licensed.
The tables give each study's mutations per maternal transmission in the region measured, with separate implied ages for sapiens and for sapiens, Neanderthals and Denisovans together. Each figure spans exactly the stretch of the molecule its study sequenced, with the raw count (events / transmissions) or the model's formula beneath it, and for whole-genome cells the rate per site per year. Model marks a converted or fitted figure rather than a count. Blanks mean no separate estimate. The Count / method column separates raw detections, transmission models and persistent substitutions. Calculating an age from a detection rate does not make it a valid ancestry clock.
Ages assume 25 years per generation; a study's own interval raises its age by that ratio (deCODE's 29.3 years by 1.172, Connell's 26.9 by 1.076). The sapiens column uses Behar's 57.1-change root-to-tip depth for the whole molecule, allocated to smaller windows by the root-to-tip profile of the 54 modern sequences, measured from the reconstructed root (RSRS) and scaled by 57.1/50.241. The all-three column is the largest between-group mean distance in that region, divided by twice the lineage rate. It treats the tips as contemporaneous and is a distance-based baseline, not a fitted MRCA date. The header gives the standard region coordinates; where a study's window was recounted (Howell 1996's 1,194 bp, Heyer's 673, Forster's 579, deCODE's callable 1,092 and 15,443, and in Connell's partition HVR-II ending at 371 and a 447-bp rest of the control region), the cell gives the window used. The calculation methods and fossil-age check explain the regional approximation and age corrections. ka = thousand years; Ma = million years.2223
For zero observed events, an asterisk marks a conditional one-sided 95% Poisson limit, −ln(0.05) divided by transmissions, not a measured zero rate. No age is assigned where the necessary site-class match is missing. Rows from the same study are not independent, and the six rows marked "as tabulated by Howell 2003" come from Howell's pooled Table 2, not from the original papers.
Measured directly, in living families
| Study | Whole genome1–16,569 · 16,569 bp | Count / method | Transmissions | Pedigrees | Sapiens age | All-three age baseline | Method and caveats | |||
|---|---|---|---|---|---|---|---|---|---|---|
| Control region16,024–576 · 1,122 bp | Coding region577–16,023 · 15,447 bp | |||||||||
| HVR-I16,024–16,383 · 360 bp | HVR-II57–372 · 316 bp | Rest16,384–56, 373–576 · 446 bp | ||||||||
| Howell 1996 | 0.02272 / 88 · 1,194 bp | — | DetectedNew germline mutations, both heteroplasmic (HVR-II nt 152 and 195), plus one somatic | 88 | 1 LHON pedigree, 45 members | 17 ka | 29.5 ka | Opened the pedigree-rate literature: the “ten times faster” claim began with two events in one disease pedigree. The primary sequenced nt 16024–16569 and 1–648 (about 1,194 bp), the control region plus 72 adjoining coding bases. Howell 2003 restates 2/88; Sigurðardóttir 2000 says 2/81. | ||
| Bendall 1996as tabulated by Howell 2003 | 0.01114 / 360 · 360 bp | — | — | — | DetectedNewly arising substitutions, heteroplasmic or homoplasmic, as Howell pooled them | 360 | Not given in Howell’s table | 17.7 ka | 32.8 ka | Howell 2003 Table 2: 4/360, divergence rate 0.99 (99.5% interval 0.14–3.35) per site per Myr, computed over Howell’s 1,122-bp convention at 20-year generations. HVR-1 only. The exact window was not checked; the age uses the 360-bp HVR-I window. |
| Mumm 1997as tabulated by Howell 2003 | 0.01691 / 59 · 360 bp | — | — | — | DetectedNewly arising substitutions, heteroplasmic or homoplasmic, as Howell pooled them | 59 | Not given in Howell’s table | 11.6 ka | 21.5 ka | Howell 2003 Table 2: 1/59, divergence rate 1.51 (99.5% interval 0.00–11.71) per site per Myr, computed over Howell’s 1,122-bp convention at 20-year generations. HVR-1 only; one event. The exact window was not checked; the age uses the 360-bp HVR-I window. |
| Parsons 1997 | 0.030610 / 327 · ~610 bp | — | — | DetectedSubstitutions between close relatives; heteroplasmic and homoplasmic both counted, per Howell 2003 | 327 | 134 maternal lineages of close relatives | 10.2 ka | 14.4 ka | The load-bearing young-earth citation. Ten differences across about 610 bp of HVR-I and HVR-II, not the whole molecule. The ~610 bp and the 20-year generation are reverse-engineered from the published 2.5/site/Myr; exact endpoints are unverified, so the age uses a broad HVR-I+II profile. The abstract gives the count. Howell’s Table 2 books this laboratory’s data as Parsons and Holland 1998 (10/306) plus the Forensic Science Service set (1/32): 11/338 together, rows below. | |
| Parsons 1997: Forensic Science Service setas tabulated by Howell 2003 | 0.03131 / 32 · 676 bp | — | — | DetectedNewly arising substitutions, heteroplasmic or homoplasmic, as Howell pooled them | 32 | Not given in Howell’s table | 11.1 ka | 15.6 ka | Howell 2003 Table 2: 1/32, divergence rate 2.76 (99.5% interval 0.01–20.43) per site per Myr, computed over Howell’s 1,122-bp convention at 20-year generations. HVR-1 and HVR-2. Howell’s footnote: “the analyses at the U.K. Forensic Science Service that were reported in Parsons et al. (1997).” One event. The age uses the 676-bp HVR-I+II window. | |
| Soodyall 1997as tabulated by Howell 2003 | 00 / 108 · 676 bp | — | — | DetectedNewly arising substitutions, heteroplasmic or homoplasmic, as Howell pooled them | 108 | Not given in Howell’s table | > 12.5 ka* | > 17.6 ka* | Howell 2003 Table 2: 0/108, divergence rate 0.00 (99.5% interval 0.00–4.79) per site per Myr, computed over Howell’s 1,122-bp convention at 20-year generations. HVR-1 and HVR-2. The Tristan da Cunha study, founded by a handful of women in the nineteenth century; Gibbons 1998 reports the same zero in 108. A zero count does not establish a zero rate. The age uses the 676-bp HVR-I+II window. | |
| Parsons and Holland 1998as tabulated by Howell 2003 | 0.032710 / 306 · 676 bp | — | — | DetectedNewly arising substitutions, heteroplasmic or homoplasmic, as Howell pooled them | 306 | Not given in Howell’s table | 10.6 ka | 14.9 ka | Howell 2003 Table 2: 10/306, divergence rate 2.91 (99.5% interval 0.99–6.44) per site per Myr, computed over Howell’s 1,122-bp convention at 20-year generations. HVR-1 and HVR-2; the same laboratory as Parsons 1997. The exact window was not checked; the age uses the 676-bp HVR-I+II window. | |
| Cavelier 2000: CR | 00 / 292 · 1,122 bp | — | HomoplasmicHomoplasmic substitutions only | 292 | 33 maternal lineages, 194 people | > 37.5 ka* | > 64.1 ka* | No homoplasmic substitutions detected; a zero count does not establish a zero mutation rate. Only length heteroplasmy, at three poly-C sites (65, 309, 16189). The zero result routinely left out of compilations on both sides. The limit assumes independent detectable events. Howell 2003 books the study as HVR-1 and HVR-2, 0/292. | ||
| Cavelier 2000: coding sample | — | — | — | 00 / 292 · positions 5,550–6,050 · 500 bp | HomoplasmicHomoplasmic substitutions only | Same 292 | Same | > 1.23 ka* | > 6.79 ka* | 5550–6050 is 501 inclusive positions; the paper calls it 500 bp. The zero-count limit uses that window. |
| Sigurðardóttir 2000 | 0.004263 / 705 · 673 bp | — | — | HomoplasmicBase substitutions between relatives: the three homoplasmic changes, per Howell 2003 | 705 | 26 large Icelandic pedigrees, 272 people | 81.1 ka | 114 ka | Largest pre-genomic study, about 8 times slower than Parsons. The published HVR mask is 673 bp; the fully sequenced amplicon is nt 16012–394 (~952 bp), and inclusive endpoint arithmetic does not reproduce 673. Madrigal’s Table 3 pairs Howell’s count with Sigurðardóttir’s rate. | |
| Sigurðardóttir 2000: rescored | 0.007095 / 705 · 673 bp | — | — | Detected; rescoredHomoplasmic and heteroplasmic changes, Howell’s rescoring | Same 705 | Same | 48.7 ka | 68.6 ka | Howell’s five-event rescoring of the same data, using the study’s published 673-bp HVR mask; not an independent study. | |
| Heyer 2001 | 0.007874 / 508 · 673 bp | — | — | Pedigree differencesSubstitutions between relatives; pooled with earlier studies, 18 / 1,729 = 0.0104 | 508 | Deep-rooting French-Canadian pedigrees (Quebec) | 44 ka | 62 ka | HVR-I 16024–16383 and HVR-II 58–370. Only 12 of the pooled 18 mutations sat at independent sites; three positions mutated twice. Fitted model: 40 fast sites (CI 27–54) at 274 per site per million generations. The pooled count overlaps other studies. | |
| Forster 2002: low radiation | 0.0051 / 200 · 579 bp | — | Detected heteroplasmyNew heteroplasmies only; none homoplasmic at either dose | 200 | 248 Kerala families, 988 people, across 2 to 4 generations (795 transmissions in both groups) | 68.2 ka | 86.5 ka | 16093–16390 and 35–315: parts of both HVRs plus adjoining bases. Kerala natural radioactivity, low-dose group. | ||
| Forster 2002: high radiation | 0.03722 / 595 · 579 bp | — | Detected heteroplasmyNew heteroplasmies only; none homoplasmic | 595 | Same families | 9.22 ka | 11.7 ka | A 7.4-fold rise in heteroplasmies appearing, and zero fixations. The radiation-hit positions “mutate, on average, 12 times faster during evolution.” The exposure comparison is not a universal clock. | ||
| Howell 2003: own pedigreesas tabulated by Howell 2003 | 0.005411 / 185 · 1,122 bp | — | DetectedNewly arising substitutions, heteroplasmic or homoplasmic, as Howell pooled them | 185 | Not given in Howell’s table | 71.3 ka | 122 ka | Howell 2003 Table 2: 1/185, divergence rate 0.48 (99.5% interval 0.00–3.87) per site per Myr, computed over Howell’s 1,122-bp convention at 20-year generations. Control region nt 16024–16569 and 1–576 in five LHON families. One event; included in the pooled row below. | ||
| Howell 2003: pooled CR | 0.010628 / 2,633 · pooled · 1,122 bp | — | Detected; pooledEverything newly arising, heteroplasmic or homoplasmic | 2,633 | 5 LHON pedigrees (185 transmissions) plus nine earlier data sets | 36.2 ka | 61.9 ka | The canonical pooled rate, published as a divergence rate of 0.95/site/Myr (twice the mutation rate; 99.5% interval 0.53–1.57) at 20-year generations, treating every study as 1,122 bp. Multiplying it across 16,569 sites is Carter’s error. Regions and assays differ between the pooled studies. Table 2’s ten study rows sum to 2,643 transmissions, not the printed 2,633. | ||
| Howell 2003: coding counts | — | — | — | 0.008664 / 462 · Subset | Pedigree eventsCoding-region events in partially sequenced LHON pedigrees | 462 | LHON pedigrees and Cavelier’s families | Not calculated | Not calculated | Mixed coverage: earlier LHON fragments, later coding sequences, Cavelier’s 500 bp. The 6,773 bp in Howell 1996 is not the common mask of all 462 transmissions. The raw count has no matched age. |
| Howell 2003: coding approximation | — | — | — | 0.00927 model0.06/site/Myr divergence, halved, × 15,447 × 20 y · 15,447 bp | Full-region lower estimateThe same coding events, converted to a rate | Same | Same | 112 ka | 427 ka | Published 0.06/site/Myr divergence rate (99.5% CI 0.008–0.20), halved, then converted using the study’s 20-year generation. Treating partial coverage as complete coding coverage makes this conservative; it is not a directly observed whole-coding rate. |
| Santos 2005: germinal | 0.01876 / 321 · ~610 bp | — | — | Detected; germinal classNew point substitutions, all heteroplasmic, classified somatic or germinal | 321 | Azores families; heteroplasmy in 72% of them | 16.7 ka | 23.6 ka | Six germinal events; 0.034 = 11/321 counting the five judged somatic. Counts from the abstract; exact windows are unverified, so the regional age is approximate. | |
| Santos 2005: corrected | 0.0037 modelmodel, corrected to fixation · ~610 bp | — | — | Transmission modelThe germinal events, corrected for loss before fixation | Same 321 | Same | 84.4 ka | 119 ka | First pedigree study to apply the arising-to-fixing correction; its corrected 0.2415/site/Myr lands “in the upper end” of phylogenetic values. A model-corrected rate for the measured region, not a direct homoplasmic count; it must not be assigned to 16,569 bases. | |
| Madrigal 2012: maximum | 0.02567 / 273 · 360 bp | — | — | — | Pedigree differencesSubstitutions between relatives; heteroplasmy status not stated | 273 | 19 deep-rooting Costa Rican pedigrees of at least 7 generations; 53 people typed | 7.67 ka | 14.2 ka | HVR-I, 360 bp. Generation time measured, 28.3 years over 289 meioses: at that interval multiply these ages by 1.132. The text reports 7 events over 299 meioses; its printed 71.1 × 10⁻⁶ per site per generation equals 7/273. Three of the mutated sites are known hot spots. The abstract’s 1.24 × 10⁻⁶ per site per year appears nowhere in the results. |
| Madrigal 2012: minimum | 0.009092 / 220 · 360 bp | — | — | — | Pedigree differencesSubstitutions between relatives; heteroplasmy status not stated | 220 | Same | 21.6 ka | 40.1 ka | Excluding a pedigree and hot-spot sites as the paper does leaves 2/220. Different branch and hot-spot exclusions define the two counts. |
| Guo 2013 | 00 / 26 · 3,981× depth · 16,569 bp · < 2.78 × 10⁻⁷ per site per year | HomoplasmicHomoplasmic changes; heteroplasmies followed down to 0.1% | 26 | 18 families, 44 people; mother–child pairs plus 9 sibling pairs | > 12.4 ka* | > 39.1 ka* | No discordant homoplasmic SNPs; 12 heteroplasmies shared by mother and child. A zero count does not exclude rare events, and 26 transmissions give only a weak bound. The mothers were childhood-cancer survivors with uterine irradiation, which biases the count upward. Implies a bottleneck near 200, the high outlier. | |||
| Rebolledo-Jaramillo 2014: arising | 0.143 modelα = μ0/(2 ln 99); μ0 = 51/(39 × 16,569) observed · 16,569 bp · 3.45 × 10-7 per site per year | Arising-rate modelGermline point heteroplasmies at ≥ 1% in both blood and buccal tissue, fed into a transmission model | 39 | 39 mother–child pairs, two tissues each | 9.98 ka | 31.5 ka | Fitted arising parameter α. The paper estimates μ0 as 51/(39 × 16,569 bp): the 51 are heteroplasmies observed above its 1% threshold, which include inherited variation; they are not 51 new mutations. 39% of heteroplasmies were tissue-specific, so somatic. | |||
| Rebolledo-Jaramillo 2014: retained | 0.0045 model2.7 × 10-7 per site per generation × 16,569 ≈ 0.0045; bottleneck 32.3 · 16,569 bp · 1.09 × 10-8 per site per year | Transmission modelThe same heteroplasmies, divided by the measured bottleneck | Same 39 | Same | 317 ka | 1 Ma | The paper that writes μ = α/N. Fitted μ after frequency and bottleneck modelling (IQR 8.3 × 10⁻⁸ to 8.2 × 10⁻⁷ per site per generation), not a direct count of homoplasmic changes. The authors call their estimate a lower bound. The best usable clock parameter from this study. | |||
| Rebolledo-Jaramillo 2014: D-loop retained | 0.00168 model1.5 × 10-6 per site per generation × 1,122 · 1,122 bp | — | Transmission modelD-loop heteroplasmies, modelled separately | Same 39 | Same | 229 ka | 391 ka | The paper’s separately modelled D-loop rate; its interquartile range, 4.8 × 10⁻⁷ to 4.7 × 10⁻⁶, spans tenfold. | ||
| Ding 2015: heteroplasmy gains | 0.423141 / 333 · ≥ 4% MAF · ~180× · 16,569 bp · 1.02 × 10-6 per site per year | Detected discordanceHeteroplasmic discordance between mother and child, lymphocytes only | 333 | 333 Sardinian parent–child trios | 3.37 ka | 10.7 ka | Child variants absent from the mother’s called class. Discordance between tissues sampled from mother and child is not automatically a new germline mutation; threshold, somatic origin and calling errors prevent identifying a retained rate. | |||
| Ding 2015: homoplasmy discordance | 0.18963 / 333 · 35 gains (0.105) + 28 losses · 16,569 bp · 4.57 × 10-7 per site per year | Discordant callsHomoplasmic discordance between mother and child, either direction | Same 333 | Same | Not calculated | Not calculated | The dataset behind Jeanson’s rate: 28 of his 63 discordances are variants the mother had and the child lost. The authors read the 35 child-not-mother calls as noise, and they were never re-examined at the read level. Gains and losses cannot both simply be counted as new inherited substitutions. Not a validated mutation rate. | |||
| Jeanson 2015 synthesis, for comparison | 0.15863 / 398 · 16,569 bp · 3.82 × 10-7 per site per year | Proposed mutation clockHomoplasmic discordances in Ding 2015, pooled with Guo and Rebolledo-Jaramillo (both zero), treated as homoplasmic changes | 398 | Three studies pooled | 9.02 ka | 28.5 ka | Mostly Ding’s unvalidated discordances. Predicts 4.1 homoplasmic changes in Guo’s 26 transmissions (0 seen), 54.6 in Norfolk’s 345 (2 seen) and 242 near-homoplasmic events in Wei’s 1,526 (3 seen). Shown to test the proposal, not as a measured rate. | |||
| Wei 2019: detected | 0.313477 / 1,526 · > 1% VAF · ~1,900× · 16,569 bp · 7.55 × 10-7 per site per year | Detected de novoNew heteroplasmies above 1% in the child’s blood | 1,526 | 1,526 mother–offspring pairs, whole blood | 4.57 ka | 14.4 ka | 614 maternal heteroplasmies lost against 477 gained. Offspring blood variants undetected in the mother; not all germline or destined to persist. Low-level against near-homoplasmic is a factor of 159 in one generation: a snapshot, not the eventual fate of the 477. | |||
| Wei 2019: control | 0.0858131 / 1,526 · 1,122 bp | — | Detected de novoThe same events in the D-loop | Same | Same | 4.49 ka | 7.66 ka | 131 D-loop events; the supplementary Table S2’s printed 13 is inconsistent with its rate and totals. Regional clock illustration only. | ||
| Wei 2019: coding | — | — | — | 0.227346 / 1,526 · 15,447 bp | Detected de novoThe same events outside the D-loop (genes, rRNA, tRNA) | Same | Same | 4.6 ka | 17.4 ka | 346 outside-D-loop events. Same tissue and threshold limitations. |
| Wei 2019: frequency weighted | 0.0194 model477 × 0.062 / 1,526 · 16,569 bp · 4.68 × 10-8 per site per year | Neutral illustrationThe 477, each weighted by its heteroplasmic fraction | Same | Same | 73.7 ka | 233 ka | Σ-frequency approximation. Blood is not the germline; selection and undetected variants remain unmodelled. | |||
| Wei 2019: above 80% | 0.001973 / 1,526 · 16,569 bp · 4.75 × 10-9 per site per year | Near-homoplasmicDe novo variants above 80% heteroplasmic fraction | Same | Same | 726 ka | 2.29 Ma | Two of the three events have ascertainment concerns. Above 80% is not complete homoplasmy, and no population-wide fixation estimate follows. | |||
| Zaidi 2019 | 0.00782 model4.72 × 10-7 per site per generation × 16,569 · ~11,400× · 16,569 bp · 1.89 × 10-8 per site per year | Transmission modelGermline heteroplasmies (in both blood and buccal) converted to a fixation rate through a bottleneck of 10.3 | 249 | 96 families, 345 people, 2 to 4 generations, at least 2 siblings per mother | 183 ka | 577 ka | Independent of Rebolledo-Jaramillo, with a bottleneck three times smaller; per transmission it is 1.7 times Rebolledo-Jaramillo’s retained rate. Nonsynonymous-to-synonymous occurrence 0.43. A model-inferred germline rate, not a count of observed homoplasmic transitions. | |||
| Connell 2022: all | 0.02619 / 345 · Sanger · 16,569 bp · 6.30 × 10-8 per site per year | Detected; mixed classHomoplasmic changes plus heteroplasmies above 20% MAF | 345 | 45 maternal lineages, 225 people, from the last four generations of an 11-generation island pedigree | 54.7 ka | 173 ka | Norfolk Island. Seven heteroplasmies and two homoplasmic changes; retaining or excluding heteroplasmy changes the estimand. Its control-region rate, 0.469/site/Myr, matches Howell 2003’s pooled 0.475. Population-specific pedigree. | |||
| Connell 2022: homoplasmic | 0.00582 / 345 · 16,569 bp · 1.40 × 10-8 per site per year | HomoplasmicThe two homoplasmic transitions only | Same 345 | Same | 246 ka | 778 ka | The best direct retained-change count here, but only two events, so its interval is broad. No bottleneck model anywhere in the derivation; its published 1.30 × 10⁻⁸ per site per year is 0.78 times the phylogenetic rate. At the paper’s 26.9-year interval, multiply ages by 1.076. Detection and family structure still require modelling. | |||
| Connell 2022: control, all | 0.01455 / 345 · 1,122 bp | — | Detected; mixed classThe nine events, by position | Same 345 | Same | 26.6 ka | 45.4 ka | The same nine-event study, partitioned by the positions in its Table 1. HVR-II ends at 371 here. One or zero events give weak constraints. The count-derived CR rate differs slightly from the printed Table 2 estimate. | ||
| Connell 2022: control, homoplasmic | 0.00291 / 345 · 1,122 bp | — | HomoplasmicThe two homoplasmic transitions, by position | Same 345 | Same | 133 ka | 227 ka | The same nine-event study, partitioned by the positions in its Table 1. HVR-II ends at 371 here. One or zero events give weak constraints. The count-derived CR rate differs slightly from the printed Table 2 estimate. | ||
| Connell 2022: HVR-I, all | 0.01164 / 345 · 360 bp | — | — | — | Detected; mixed classThe nine events, by position | Same 345 | Same | 17 ka | 31.4 ka | The same nine-event study, partitioned by the positions in its Table 1. HVR-II ends at 371 here. One or zero events give weak constraints. |
| Connell 2022: HVR-I, homoplasmic | 0.00291 / 345 · 360 bp | — | — | — | HomoplasmicThe two homoplasmic transitions, by position | Same 345 | Same | 67.9 ka | 126 ka | The same nine-event study, partitioned by the positions in its Table 1. HVR-II ends at 371 here. One or zero events give weak constraints. |
| Connell 2022: HVR-II, all | — | 0.00291 / 345 · 315 bp | — | — | Detected; mixed classThe nine events, by position | Same 345 | Same | 51.6 ka | 42.8 ka | The same nine-event study, partitioned by the positions in its Table 1. HVR-II ends at 371 here. One or zero events give weak constraints. |
| Connell 2022: HVR-II, homoplasmic | — | 00 / 345 · 315 bp | — | — | HomoplasmicThe two homoplasmic transitions, by position | Same 345 | Same | > 17.2 ka* | > 14.3 ka* | The same nine-event study, partitioned by the positions in its Table 1. HVR-II ends at 371 here. One or zero events give weak constraints. |
| Connell 2022: rest of CR, all | — | — | 00 / 345 · 447 bp | — | Detected; mixed classThe nine events, by position | Same 345 | Same | > 4.48 ka* | > 19.5 ka* | The same nine-event study, partitioned by the positions in its Table 1. HVR-II ends at 371 here. One or zero events give weak constraints. |
| Connell 2022: coding, all | — | — | — | 0.01164 / 345 · 15,447 bp | Detected; mixed classThe nine events, by position | Same 345 | Same | 89.9 ka | 341 ka | The same nine-event study, partitioned by the positions in its Table 1. HVR-II ends at 371 here. One or zero events give weak constraints. |
| Connell 2022: coding, homoplasmic | — | — | — | 0.00291 / 345 · 15,447 bp | HomoplasmicThe two homoplasmic transitions, by position | Same 345 | Same | 360 ka | 1.36 Ma | The same nine-event study, partitioned by the positions in its Table 1. HVR-II ends at 371 here. One or zero events give weak constraints. |
| Árnadóttir 2024: all | 0.07038,199 / 116,663 · 16,569 bp · 1.70 × 10-7 per site per year | Detected; branch inferredEvery mutation reaching 5% of reads, with one carrier at 10% or more | 116,663 | 64,806 living Icelanders in 2,548 matrilines (deCODE genealogy) | 20.3 ka | 64.2 ka | Seventy-five times larger than anything before it. Hypermutable positions dominate the count; the control region runs 8.3 times the coding rate per site. At deCODE’s 29.3-year interval, multiply ages by 1.172. A tight bottleneck is not a universal divisor converting this count into retained substitutions. | |||
| Árnadóttir 2024: control | 0.026 model2.38 × 10-5 per site × 1,092 callable · 1,092 bp | — | Detected; regionalThe same events in the control region | Same | Same | 14.4 ka | 24.6 ka | Callable CR denominator: 1,092 bp after exclusions. Published per-site parameter; the age uses the broader CR profile. Threshold and hypermutable sites limit its use as a clock. | ||
| Árnadóttir 2024: coding | — | — | — | 0.0443 model2.87 × 10-6 per site × 15,443 callable · 15,443 bp | Detected; regionalThe same events in the coding region | Same | Same | 23.5 ka | 89.2 ka | 16,535 attempted sites minus 1,092 CR sites gives 15,443. The age uses the broader coding profile; selection and detection thresholds affect the connection to a long-run clock. |
| Arbeithuber 2025: total | 0.74352 / 70 · ≥ 1% VAF · duplex sequencing, error < 10-7 · 16,569 bp · 1.79 × 10-6 per site per year | Detected in oocytesDe novo mutations at 1% or more of a single oocyte’s mtDNA copies, counted before any transmission | 70 | 80 single oocytes from 22 women aged 20–42, with blood and saliva from each donor | 1.92 ka | 6.07 ka | The fastest human rate measured and the purest arising rate: counted in the germ cell itself, before bottleneck, drift or transmission. No rise with maternal age in oocytes (P = 0.688) against a rise in blood (P = 0.0027). Mature oocytes have already experienced selection; this is not a retained-lineage rate. | |||
| Arbeithuber 2025: D-loop | 0.443 model3.95 × 10-4 per site per generation × 1,122 · 1,122 bp | — | Detected in oocytesThe same mutations in the D-loop | Same | Same | 0.869 ka | 1.48 ka | The authors’ own regional split. Surviving egg variants are not equivalent to homoplasmic descendant sequences. | ||
| Arbeithuber 2025: coding genes | — | — | — | 0.3 model1.95 × 10-5 per site per generation × 15,359 · 15,359 bp | Detected in oocytesThe same mutations in genes, rRNA and tRNA | Same | Same | 3.46 ka | 13.1 ka | Protein, rRNA and tRNA genes total 15,359 bp; the 88 bp of other non-coding sequence are reported separately and are not in this denominator. The age uses a coding-region approximation. |
Table sources: 102 26 2 103 104 105 81 106 8 41 33 24 20 4 34 5 12 42
Read the Wei 2019 rows together and the argument of this article is on one line. The same 1,526 transmissions give 0.313 and 0.00197 per transmission depending on which quantity is counted, a factor of 159. The second figure is a one-generation snapshot of variants already near fixation, not a measured rate of permanent change, so the factor shows how far a count moves with its threshold rather than measuring how many variants are lost. Connell's two whole-molecule rows do the same thing at a factor of 4.5, and Connell's homoplasmic figure of 1.30 × 10⁻⁸ per site per year lands near Soares's phylogenetic rate of 1.665 × 10⁻⁸ with no ape, no radiocarbon and no bottleneck model anywhere in the derivation.645
Calibrated on ancient DNA or the chimpanzee
The chimpanzee-calibrated rows are the rates the circularity charge is aimed at, and the charge lands. Each is a measured ratio, human tree depth divided by human-chimpanzee distance, multiplied by an assumed number of years. The measurement is real; the years are an input. The ancient-DNA rows below them are tip-calibrated on radiocarbon-dated bone: no ape, no divergence date, no assumed migration. The column of the authors’ own ages gives each paper’s date from its own tree and model; the next two columns are the standardized depth division used throughout these tables.
| Study | Whole genome1–16,569 · 16,569 bp | What was compared | Calibration assumed | Authors’ age of Eve | Sapiens age | All-three age baseline | Method and caveats | |||
|---|---|---|---|---|---|---|---|---|---|---|
| Control region16,024–576 · 1,122 bp | Coding region577–16,023 · 15,447 bp | |||||||||
| HVR-I16,024–16,383 · 360 bp | HVR-II57–372 · 316 bp | Rest16,384–56, 373–576 · 446 bp | ||||||||
| Horai 1995: control | 0.002 model1,143 bp · 7.00 × 10-8 per site per year | — | 3 human and 4 ape complete genomes | Orangutan–African ape split at 13 Myr; the human–chimp 4.87 Myr is an output | 143 ka ± 18 (synonymous and D-loop); 450 ka ± 70 (nonsynonymous and RNA sites, same paper) | 196 ka | 335 ka | The 7.00 × 10⁻⁸ D-loop rate is itself derived from the 3.89 × 10⁻⁸ synonymous rate. 1,143-bp control-region convention; the regional distance is approximate. Other site classes give different dates. | ||
| Ingman 2000 | — | — | — | 0.00656 model15,426 bp · 1.70 × 10-8 per site per year | 53 human genomes and 1 chimpanzee; D-loop excluded | Human–chimp split at 5 Myr | 171.5 ka ± 50 | 159 ka | 602 ka | Uses the coding distance, not the 57.1 whole depth. |
| Mishmar 2003 | — | — | — | 0.00487 model15,447 bp · 1.26 × 10-8 per site per year | 104 human genomes, coding region | Human–chimp split at 6.5 Myr | 198 ka ± 19 | 214 ka | 813 ka | Selection and calibration uncertainty remain relevant; the paper argues for climatic selection while dating with a strict clock. |
| Kivisild 2006: synonymous | — | — | — | Not determined modelSubset · 3.50 × 10⁻⁸ per site per year | 277 genomes, synonymous transitions only | 6 Myr species split; 6.5 Myr mtDNA coalescence | 160 ka (SD 22) | Not calculated | Not calculated | The rate is per synonymous site. No matching synonymous-site count and root profile was established here, so neither a per-transmission figure nor an implied age is calculated. |
| Endicott & Ho 2008: external | — | — | — | 0.000687 model7,198 bp · 3.82 × 10-9 per site per year | 177 human and 2 chimpanzee genomes; 1st and 2nd codon positions (7,198 bp) analysed alone | Human–chimp split, lognormal, 95% within 5–7.5 Myr | 162 ka (122–213) from the concatenated 11,940 bp at 6.81 × 10⁻⁸; 310 ka (158–508) from these positions alone | Not calculated | Not calculated | Table 3’s separately analysed PC1+2 rate (95% HPD 2.44–5.06 × 10⁻⁹). Matching root counts for these positions were not established, so no age is calculated here. |
| Endicott & Ho 2008: internal | — | — | — | 0.00234 model7,198 bp · 1.30 × 10-8 per site per year | The same 177 genomes and software, calibration swapped | Haplogroup P in Sahul at 40–55 ka, plus H1 and H3 at about 18 ka. No ape | 108 ka (82–134) from the concatenated 11,940 bp at 9.66 × 10⁻⁸; 79 ka (60–106) from these positions alone | Not calculated | Not calculated | Table 3’s separately analysed PC1+2 rate (1.01–1.58 × 10⁻⁸), 3.4 times the external one. Not a direct pedigree measurement. |
| Soares 2009 | 0.0069 model16,569 bp · 1.67 × 10-8 per site per year | Tree of 2,196 complete genomes, corrected for purifying selection | Human–chimp split at 6.5 Myr plus 0.5 Myr lineage coalescence | 192.4 ka (Figure 6) | 207 ka | 654 ka | The benchmark every pedigree rate is compared against; a model output, not a count. The table uses its summary whole-molecule rate (one mutation every 3,624 years), not the full age-dependent function. The coding-region cross-check gives a very similar 1.708 × 10⁻⁸. | |||
| Soares 2009: HVS-I | 0.0015 model350 bp · 1.71 × 10-7 per site per year | — | — | — | The same tree, HVS-I 16051–16400 (350 bp) | Scaled against the synonymous clock | Same tree | 128 ka | 236 ka | The paper’s average of 1.62 × 10⁻⁷ and 1.784 × 10⁻⁷: “1 mutation every 16,677 years” in the segment. Its window differs from HVR-I 16024–16383; the age uses the HVR-I profile. |
| Fu 2013 | 0.0111 model16,569 bp · 2.67 × 10-8 per site per year | 10 dated ancient and 311 modern genomes | Radiocarbon-dated tips; Bayesian relaxed clock | 157 ka (120–197) | 129 ka | 408 ka | Dates, site corrections and shared ancestry matter. | |||
| Brotherton 2013 | 0.00994 model16,569 bp · 2.40 × 10-8 per site per year | 39 Neolithic and Bronze Age genomes | Holocene-only tip calibration | — | 144 ka | 454 ka | A published genome-rate summary rather than a raw homoplasmic count. | |||
| Rieux 2014 | 0.00888 model16,569 bp · 2.14 × 10-8 per site per year | 26 retained ancient and 320 modern genomes; damage screening | Tip, node and root calibration compared | 143 ka (112–180) | 161 ka | 508 ka | Its fitted mtEve age and the standardized depth division here are different calculations. | |||
| Fu 2014 | 0.0105 model16,569 bp · 2.53 × 10-8 per site per year | The Ust’-Ishim femur and 311 modern genomes | A single dated tip | — | 136 ka | 430 ka | The specimen date is part of the inference. | |||
| Posth 2016 | 0.0113 model16,569 bp · 2.74 × 10-8 per site per year | 66 dated ancient and 311 modern genomes | Dated tips; Bayesian skyline, strict rate | — | 126 ka | 397 ka | Shares some comparison data with earlier work. | |||
| Cabrera 2021: youngest bin | 0.0179 model16,569 bp · 4.33 × 10-8 per site per year | 423 dated and 784 modern genomes | Direct mutation counts by age bin, no tree | — | 79.6 ka | 251 ka | The same data, binned by age, give a rate that falls 2.3-fold from the youngest bin to the oldest. A bin-specific rate is not automatically a rate for the complete tree. | |||
| Cabrera 2021: oldest bin | 0.00791 model16,569 bp · 1.91 × 10-8 per site per year | 423 dated and 784 modern genomes | Direct mutation counts by age bin, no tree | — | 180 ka | 570 ka | The same data, binned by age, give a rate that falls 2.3-fold from the youngest bin to the oldest. A bin-specific rate is not automatically a rate for the complete tree. | |||
| Översti & Palo 2022: U4 | 0.0365 model16,569 bp · 8.80 × 10-8 per site per year | 42 Holocene U4 genomes, no moderns | Root-to-tip regression on dated tips | — | 39.2 ka | 124 ka | The fastest defensible number in the mainstream literature, and the best single figure available to the young-earth side. It is also 42 sequences from one twig of the tree with R² = 0.37, and its own x-intercept still puts that twig’s root at 12,723 years. Not an established universal mtDNA rate. | |||
| Project: U-subclade regression | 0.0107 model16,519 bp · 2.59 × 10-8 per site per year | 229 dated ancient genomes | Root-to-tip, per-subclade intercepts | — | 133 ka | 421 ka | An in-house descriptive calculation. Independent-error intervals omit phylogenetic covariance and date uncertainty. | |||
Table sources: 107 9 108 35 31 6 62 109 32 58 110 111 59 23
The two Endicott and Ho rows are the experiment. Same sequences, same alignment, same software, one thing changed, and the answer moves from 162,000 years to 108,000. On first-and-second codon positions alone the same swap moves it from 310,000 to 79,000, a fourfold spread from a methodological choice. Anyone who says the ape calibration does no work is wrong.31
Two corrections to widespread beliefs about the calibrated rows.
Cann 1987 does not belong among them. The founding paper was calibrated on assumed colonisation dates (New Guinea at 30 ka, Australia at 40 ka, the New World at 12 ka), not on the chimpanzee. Critics who dismiss mitochondrial Eve as ape-calibrated from the start have the wrong target; the ape calibration became standard later.13
The archaic dates are ape-calibrated too, and their own authors say so. Green's 660,000-year human-Neanderthal mitochondrial split rests on an assumed 6–8 Myr human-chimpanzee divergence, and Green states plainly that if that assumption "would be incorrect, the estimates in calendar years … would need to be revised."72 The Denisovan figure of 465,700 years rests on an assumed 6 Myr. Those numbers are model outputs and should never be offered as independent evidence of deep time. What the archaic comparison does establish without any calibration is the relative-rate result: the Neanderthal and Denisovan branches are no longer than the human one, and that conclusion needs no divergence date at all.
The distances the rates have to explain
Every rate above has to explain these distances. They are counts of differences, not rates. Each panel’s first line is the whole molecule: the mean over all pairs, its maximum, and the control-region total. The second line splits the mean by region, with maxima. A dagger marks the largest between-group mean in each region; half of it is the all-three column’s depth. The Behar row is a root-to-tip depth, a different quantity from a pairwise mean, and its second line is this project’s regional allocation used by the sapiens column. The Soares column converts each mean to the age of the average pair’s common ancestor at 1.665 × 10⁻⁸ per site per year, with every tip treated as living, so it sits below the root by construction.6222111265
| Panel | Whole genome1–16,569 · 16,569 bp | What is measured | Pairs | Sample | Average pair’s ancestor at Soares’s rate | Notes | |||
|---|---|---|---|---|---|---|---|---|---|
| Control region16,024–576 · 1,122 bp | Coding region577–16,023 · 15,447 bp | ||||||||
| HVR-I16,024–16,383 · 360 bp | HVR-II57–372 · 316 bp | Rest16,384–56, 373–576 · 446 bp | |||||||
| All living humans54 genomes | 59.40mean of all pairs · max 106 · control region 15.88 (max 33) | Pairwise differences within the group | 1,431 | rCRS plus Ingman’s 53 globally sampled genomes | 108 ka | Africa-heavy by design, which is why its numbers are higher than Kim and Schuster’s. Half the average pair is a pair-specific branch length, not the root-to-tip depth. | |||
| 8.19max 19 | 5.76max 16 | 1.92max 5 | 43.52max 87 | ||||||
| Behar root to tip18,843 genomes | 57.1mean · range 41–77 | Substitutions from the reconstructed root (RSRS) to each living genome | — | 18,843 complete genomes | 207 ka | The sapiens-age column’s whole-molecule anchor; median 56, SD 5.9. A 6,000-year root needs 5.74 × 10⁻⁷ per site per year: 26.8 times Rieux 2014’s rate and 34.5 times Soares 2009’s. The second line is this project’s allocation of the 57.1 by the RSRS profile of the 54 genomes (scaled by 57.1/50.241), not a figure Behar published. | |||
| 7.87allocated | 5.98allocated | 1.56allocated | 41.69allocated | ||||||
| Kim and Schuster7,098 genomes | 39.8Π · max 123 | Nucleotide diversity Π: differences between two random genomes | — | 7,098 complete genomes, 10% African | 72.1 ka | A Europe- and Asia-heavy panel. Its control-region and coding figures are Π over 1,122 and 15,447 bp; no HVR split is published. | |||
| 9.9max 32 | 29.9max 98 | ||||||||
| All Neanderthals36 records, 35 individuals | 31.49mean of all pairs · max 118 · control region 10.40 (max 29) | Pairwise differences within the group | 630 | Every near-complete Neanderthal mitogenome in GenBank at the time of the relative-rate test | 57.1 ka | About half the modern human spread. | |||
| 5.84max 20 | 3.57max 10 | 0.98max 6 | 21.09max 93 | ||||||
| All Denisovans7 records | 42.76mean of all pairs · max 86 · control region 13.76 (max 25) | Pairwise differences within the group | 21 | Seven mitogenomes | 77.5 ka | Seven records only, so the maximum means little. Wider than the Neanderthal spread despite the smaller sample. Denisova 19 and 21 have identical mtDNA. | |||
| 8.33max 14 | 4.67max 9 | 0.76max 2 | 29.00max 61 | ||||||
| Human with Neanderthalbetween groups | 199.35mean of all pairs · max 225 · control region 35.06 (max 45) | Mean pairwise differences between the two groups | 1,944 | The two panels above | 361 ka | Spread over 6,000 years at 25-year generations, it needs 0.415 retained changes per lineage per generation, with tips treated as contemporaneous. | |||
| 20.50max 30 | 9.03max 16 | 5.52max 9 | 164.29max 182 | ||||||
| Human with Denisovanbetween groups | 360.83†mean of all pairs · max 391 · control region 44.42 (max 56) | Mean pairwise differences between the two groups | 378 | The two panels above | 654 ka | Spread over 6,000 years at 25-year generations, it needs 0.752 retained changes per lineage per generation, with tips treated as contemporaneous. | |||
| 25.44max 32 | 8.70max 16 | 10.27max 14 | 316.42†max 341 | ||||||
| Neanderthal with Denisovanbetween groups | 349.79mean of all pairs · max 378 · control region 52.62† (max 57) | Mean pairwise differences between the two groups | 252 | The two panels above | 634 ka | Spread over 6,000 years at 25-year generations, it needs 0.729 retained changes per lineage per generation, with tips treated as contemporaneous. | |||
| 29.13†max 34 | 9.92†max 12 | 13.58†max 17 | 297.17max 322 | ||||||
| Human with Sima de los Huesosbetween groups | 279.33mean of all pairs · max 296 · control region 20.15 (max 27) | Mean pairwise differences between the groups | 54 | 54 living humans against the one Sima sequence | 506 ka | One sequence only. Not used by the all-three column, which takes the three groups with several sequences each. | |||
| 7.17max 12 | 7.98max 13 | 5.00max 7 | 259.19max 269 | ||||||
| All three pooled97 genomes | 154.17mean of all pairs · max 391 · control region 27.44 (max 57) | Pairwise differences across all 97 | 4,656 | The three panels above | 279 ka | Uncorrected pairwise figures, not model split dates. Half the pooled average underestimates the root, because many pairs share younger ancestors. | |||
| 15.55max 34 | 7.29max 16 | 4.60max 17 | 126.73max 341 | ||||||
Fossil ages can materially change the all-three column. For example, Denisova 19 differs from the modern panel by a mean 351.111 changes. Applying its assigned layer interval of 187–217 ka to Rieux's rate gives a human-Denisova-19 ancestor around 588–603 ka. Using deCODE's raw detection rate instead gives 156–171 ka: an ancestor younger than the assigned fossil age, so that simple combination fails. These are conditional pair calculations, not fitted all-three dates. The companion shows the formula and additional rates.11323
So what is the honest number?
Take the most robust measurement of tree depth available: Behar's reconstruction gives a mean of 57.1 substitutions from the reconstructed root to a modern mitochondrial genome, across 18,843 sequences. Divide that depth by each published rate, and sort the answers. The ages below use the same convention as Every rate measurement, in one place: counts per transmission at 25 years a generation, or a published rate per site per year over 16,569 sites. A study's own generation interval raises its age in proportion, so deCODE's raw count gives about 20,300 years at 25 years and about 24,000 at deCODE's own 29.3. The shortfall column is the factor by which each rate falls short of the 0.238 lasting changes per generation a 6,000-year Eve needs.
| Rate used | What it counts | Per 25-year generation | Implied age of Eve | Shortfall for 6,000 years |
|---|---|---|---|---|
| Wei 2019, new variants above 80% in the child | near-fixed in one generation, a snapshot | 0.00197 | ~726,000 years | 121x |
| deCODE 2024, threshold-corrected and divided by its bottleneck | sensitivity check | 0.0040 | ~360,000 years | 60x |
| Rebolledo-Jaramillo 2014, modelled retained rate | staying, by model | 0.0045 | ~317,000 years | 53x |
| Connell 2022, fixed changes only | staying | 0.0058 | ~246,000 years | 41x |
| Soares 2009, chimp-calibrated | staying | 0.0069 | ~207,000 years | 34x |
| Zaidi 2019, heteroplasmy converted to fixation | staying, by model | 0.0078 | ~183,000 years | 30x |
| Rieux 2014, radiocarbon tip-calibrated | staying | 0.0089 | ~161,000 years | 27x |
| Fu 2013, radiocarbon tip-calibrated | staying | 0.0111 | ~129,000 years | 22x |
| Posth 2016, radiocarbon tip-calibrated | staying | 0.0113 | ~126,000 years | 21x |
| Cabrera 2021, youngest age bin only | staying, one bin | 0.0179 | ~80,000 years | 13x |
| deCODE 2024, divided by its own bottleneck of 3 only | sensitivity check | 0.0234 | ~61,000 years | 10x |
| Översti & Palo 2022, haplogroup U4 only | staying, one clade | 0.0365 | ~39,000 years | 6.5x |
| deCODE 2024, every mutation detected at 5% of reads | appearing | 0.0703 | ~20,300 years (24,000 at deCODE's 29.3-year generation) | 3.4x |
| Jeanson 2015 pedigree | appearing | 0.158 | ~9,000 years | 1.5x |
| Wei 2019, new heteroplasmies | appearing | 0.313 | ~4,600 years | none |
| Arbeithuber 2025, mutations counted inside the egg | appearing | 0.743 | ~1,900 years | none: it overshoots |
| Required for a 6,000-year Eve | 0.238 | 6,000 years |
The bottom row is the newest measurement and the most instructive. Read as a clock, the egg study's rate puts Eve at about 1,900 years, three times too young even for a young-earth model, and The egg study explains why nobody will defend that number as a date.
The middle column is the whole dispute. Every rate of lasting change measured across the whole tree puts Eve at about 126,000 years or older. Every rate that counts mutations appearing puts her at 24,000 years or younger. Nothing else about the table matters as much as that split, and the rows in between are a question of how much of the appearing-to-staying correction gets applied.
Two faster rates of lasting change are exceptions, and they help the young-earth side, so they belong here. Översti and Palo's regression for one clade, haplogroup U4, gives 8.8 × 10⁻⁸ per site per year, which would put Eve at about 39,000 years, and Cabrera's youngest age bin gives 4.33 × 10⁻⁸, about 80,000 years.59 111 A fast rate in one clade or one age bin is not automatically a rate for the whole tree, and both still sit six to thirteen times short of 6,000 years. Connell's own interval for the fixed-only rate, above, reaches down to about 73,000 years. The honest range for rates of lasting change is therefore wide, roughly 40,000 years to over a million, with the whole-tree rates clustered between 126,000 and 265,000.
Put the other way round, a 6,000-year Eve needs 57.1 changes in 6,000 years over 16,569 sites, 5.74 × 10⁻⁷ per site per year. That is about 21 times Fu's tip-calibrated rate, 27 times Rieux's and 34 times Soares'.23
deCODE's three rows all come from one dataset, and Iceland: one count, several conversions explains why one count gives three ages.
In one line: per year, at deCODE's own 29.3-year generation, the young-earth model needs mutations to accumulate about four times faster than the largest measurement delivers, and the standard phylogenetic clock needs them about 8.6 times slower. Both sides are extrapolating past their data. The difference is that when the extrapolation is checked against a direct measurement of permanent change in a real pedigree, Norfolk Island, the answer comes out on the phylogenetic side: 54.6 changes expected and 2 seen.
What would make a young history work?
Nine mechanisms have been proposed for speeding up the clock, and two whole-history models go further. The nine are ranked below by whether the mechanism is real, whether it has been measured, how much it can deliver, and whether it survives its own testable consequences. The two models come after them, as rescues 10 and 11, because they are not single multipliers but complete accounts of where the tree's depth came from. The strongest of all is rescue 11, a burst of mutation after the Flood, because a mechanism of the right size is now known; what it lacks is any evidence that it happened.
Every mechanism below competes to supply the same thing: the factor between a measured rate and 0.238 mutations per genome per 25-year generation, which is what a 6,000-year Eve requires. Which factor is needed depends on which measurement is accepted as the fixing rate: 4-fold against deCODE taken raw, 10-fold against deCODE divided by its own bottleneck (a sensitivity check, not a measured fixing rate), about 40-fold against the studies that isolated permanent change.
The choice is forced. A defender cannot use deCODE's uncorrected number as the floor and then argue that the ancestral germline bottleneck was tighter, because the bottleneck is the very thing that converts deCODE's number into a fixing rate. That would be one parameter doing two contradictory jobs. Pick a baseline first; the rescues are then measured against it.
The ranking is on whether the mechanism is real, whether it has been measured, how much it can deliver, and whether it survives its own testable consequences. One entry has moved since this list was first drawn up: the maternal age effect was ranked first because it was the best-specified mechanism nobody had tested, and it has now been tested.
1. The maternal age effect — the best mechanism on the board, and it has now been measured directly
Older mothers transmit more mitochondrial mutations. This is measured, published, and named in the titles of two separate papers. It is the maternal analogue of patriarchal drive, and unlike the paternal version it survives the objection that kills that one. Jeanson himself disposed of paternal drive, "male generation times are virtually irrelevant since mtDNA lineages stop with the men who inherit them"25, and that objection does not touch a maternal effect at all.
The numbers come from the study whose title is the maternal age effect.33 In the mother's own tissues, "the number of point heteroplasmies tripl[es] over 30 y of life." In what she passes on: "mothers who conceived under the age of 20 transmitted zero to one heteroplasmies, this number was two to three for mothers conceiving in their late 30s."
A second lever compounds with the first. Zaidi's team found both a "significant positive association with maternal age for putative de novo germline mtDNA mutations" and a germline bottleneck "which intensifies with increasing maternal age at childbirth."34 A tighter bottleneck is a smaller divisor. Maternal age therefore raises the rate at which variants appear and shrinks the number they have to fight through: both pushing the fixing rate the same way.
Priced, and the price is arithmetic done here, not a number any paper reports. Rebolledo's data were fitted with Poisson regression, whose log link makes the fitted count grow exponentially with age. Take the tripling per thirty years at face value, set the mother at age 20 as the baseline, and read the curve off at older ages. The table gives both the exponential fit the paper actually used and the straight line it never tested, because the gap between them is most of the argument.114
| Mother's age | Exponential fit (the log link) | Linear fit | Inside the data? |
|---|---|---|---|
| 20 | 1.0x | 1.0x | baseline: just below it; sampling starts near 25 |
| 40 | 2.1x | 2.3x | yes |
| 60 | 4.3x | 3.7x | just past it; the oldest mother is about 58 |
| 80 | 9.0x | 5.0x | no |
| 100 | 18.7x | 6.3x | no |
| 120 | 38.9x | 7.7x | no |
Against the factors this rescue has to supply, 4-fold, 10-fold, or about 40-fold, depending on which baseline is accepted, the exponential column clears the first two by age 100 and reaches the third only at 120. The linear column never reaches even 10-fold. This is the first rescue in this article to land in the right order of magnitude at all, and the whole of that achievement rests on the shape of a curve nobody has tested.
Five things stand against it. The first is new, it is the only one that measures the disputed quantity directly, and it did not exist when this rescue was first ranked.
The effect is absent in human eggs. Every number above is a heteroplasmy count in blood or cheek cells, used as a stand-in for what happens in the germ line. In 2025 the stand-in became unnecessary. Barbara Arbeithuber and colleagues applied duplex sequencing, an error rate below one in ten million, to 80 single human oocytes from 22 women aged 20 to 42, alongside blood and saliva from the same women.42 In blood, mutation frequency rose with age. In saliva it rose marginally. In the oocytes it did not rise at all.
| tissue | age effect |
|---|---|
| blood | P = 0.0027 |
| saliva | P = 0.057 |
| oocytes | P = 0.688; old-versus-young ratio 0.99 |
The authors put it in the title: "no age-related increase in human oocyte mitochondrial mutations." Their explanation is that the egg is protected: "mtDNA in human oocytes is protected against accumulation of mutations with aging." This is the maternal analogue of patriarchal drive tested in the one cell type that matters, and the result is flat.
State the limits fairly, because they are real. Twenty-two women is a small study. The same laboratory found the opposite in other mammals: mouse oocytes accumulate two- to threefold over nine months, and macaque oocytes rise about 2.5-fold up to age nine and then stop.42 So the null is human-specific and rests on one dataset. But it is the only direct measurement of the quantity this rescue requires, and it points the wrong way for the rescue.
The extrapolation runs far past the data. Two age ranges are in play here and they are easy to confuse. The transmitted counts, the two-to-three-fold figure, are plotted against maternal age at fertilization, which tops out near 40. The tripling is a different series: the mothers' own somatic counts, plotted against their age when they were sampled, and those run from about 25 to about 58.33 So the tripling itself is honest: it is read off the fitted curve across the width of the data, not projected beyond it. The eighteen-fold is not. It pushes the curve about forty years past the oldest woman in the study, and the 120-year row pushes it past sixty. Stretching a thirty-year trend across eighty years is exactly the kind of extension this article criticises elsewhere.
The exponential shape is an assumption, not a finding. Poisson regression uses a log link by default, so the curve is exponential by construction. Neither paper uses the words "nonlinear," "exponential" or "quadratic," and neither tests a straight line against a curve. Fitted linearly, the same tripling gives 6.3-fold at age 100 instead of 18.7-fold, so about two-thirds of the headline number comes from a modelling default rather than from anything measured. And the one study with the statistical power to settle it did not ask the question. deCODE's 116,663 transmissions could have fitted an age curve at any resolution wanted; in the full text the phrase "maternal age" occurs exactly twice, both times in the reference list, citing the two papers above. The largest mitochondrial pedigree study ever run contains no maternal-age analysis at all. This is a genuine open question and the young-earth side is entitled to say so.
The tripling is the wrong quantity. It counts heteroplasmies, mutations appearing, and mostly in the mother's somatic tissue at that. The transmitted figure is two-to-three-fold, not three-fold. And Rebolledo's own conversion of the very same data gives a fixation rate of 1.3 × 10⁻⁸ per site per year, which is the phylogenetic rate. A rescue built on an arising rate cannot be applied to a problem defined by a fixing rate without doing the conversion twice.
The text does not supply the input. This is the decisive one, and it is internal to the position rather than imposed from outside. The Genesis genealogies record no maternal ages at all. The ages given are the fathers' ages at the birth of sons, which is precisely why Carter built his argument on the paternal side, where the text hands him numbers. The one recorded post-Flood maternal age is Sarah's, and Scripture presents it as a miracle because it was abnormal: "shall Sarah, that is ninety years old, bear?" (Genesis 17:17). A model that needs routine childbearing at a hundred has to argue for it against the one case the text actually reports.
Two more limits apply to any maternal-age model. Older mothers lengthen each generation, so a model has to count mutations per year, not multiply a higher count per birth by the number of births expected from much younger mothers. And the measured female generation interval, 23.2 years averaged over 250,000 years, is long, not short.101
So the mechanism is better than patriarchal drive, the premise is worse, and the one direct measurement is null. On the evidence as it now stands this rescue should be ranked below the germline bottleneck rather than above it. It is kept at the top of the list because it remains the best-specified mechanism anyone has proposed, and because a reader is entitled to see the argument that was strongest before the oocyte data arrived, together with what happened to it.
2. A tighter germline bottleneck in the past
The fixing rate is the arising rate divided by the number of mitochondrial units that make it through the germline bottleneck. Shrink that number in ancestral populations and the fixing rate rises with no change to the mutation rate at all. Nobody on either side has proposed this, and it is better than most of what has been.
Ceiling: the ancestral bottleneck cannot go below one unit, so the gain is capped at the modern value. deCODE puts that at 3, capping this at about 3-fold. And a tighter bottleneck changes how fast variants sort, not where they end up: in a neutral model a variant's eventual chance of taking over a lineage equals its starting frequency, however narrow the bottleneck. Guo's outlier of 200 would allow far more, but Guo also observed zero fixed changes in 26 transmissions, so his own data contradict the fast rate his bottleneck estimate would license. And it cannot be combined with a deCODE baseline, for the reason given above.
3. Shorter generations
More generations per millennium means more mutations per millennium. Real, and already granted at several points in this article.
Ceiling: about 2-fold, moving from 30-year to 15-year generations, and 15 is an extreme. What limits it: it collides with rescue 1. Shorter generations mean younger mothers, and younger mothers transmit fewer mutations each. You may have one or the other at full strength, not both.
4. "You are dividing the wrong number by the wrong rate"
The strongest methodological objection in the dispute, and its premise is simply true: mitochondrial sites do not mutate at one rate, and the spread is enormous.
What kills it: partition the molecule and the requirement goes up. Sort the differences by measured site speed and the gradient runs backwards. Both computations are in the archaic section above, and both were run on this article's own alignment.
5. Carter's population-genetics identity
The sharpest argument the other side has made, because it engages the crux rather than going around it: the neutral substitution rate equals the neutral mutation rate, r = Nμ/N = μ, so drift cannot be invoked to explain away a fast arising rate. That is correct textbook population genetics.
What kills it: the wrong μ in a right equation. Kimura's identity takes as input the rate at which mutations become heritable variants in an individual. For mitochondria a variant must first take over inside the mother's own germline before it is one, and most never do. The heteroplasmy layer sits underneath the population-genetic layer and the identity does not reach into it.
6. "Heteroplasmy clears up in deep genealogies"
Right in principle, and Carter deserves credit for stating a claim that could be checked instead of one that could not.
What kills it: it was checked. Norfolk Island is a deep genealogy: 45 lineages, whole genomes, up to 18 meioses. What cleared up into fixation was 2 of 9.
7. Three mitochondrial lineages on the Ark
If Noah's three daughters-in-law carried distinct pre-Flood lineages, the deepest splits are inherited rather than accumulated, and only the distance from those nodes to the tips needs explaining. Structurally legitimate.
What kills it: not the shape. PhyloTree's two-way root is compatible with three founders, whose lines can part from Eve in two steps. The branches are the problem: founders at the three shallowest candidate nodes need 10, 13 and 14 mutations in the 1,656 years before the Flood, against 0.5 to 3.9 at measured rates; the one genuine polytomy sits 35 mutations down inside the African clade; and mean root-to-tip remains 57.1 substitutions either way.
8. Lineage-specific hypermutation
The idea that one lineage, the Neanderthals, mutated fast. The yearly speed-up a short chronology needs on the Neanderthal branch is modest, 1.4 to 2.7 times ours depending on the assumed dates, and that is within the range human lineages show.
What kills it: it solves the wrong branch. On a 6,000-year timeline the human branch needs about 0.4 lasting changes per generation too, and hypermutation in Neanderthals does nothing for it. And there is no positive evidence for a long Neanderthal branch: it measures 1.01 times ours, with a 95% ceiling of 1.36; the Denisovan branch measures 0.96; Neanderthals are half as diverse inside themselves as we are; and a search of 206 DNA-repair and mitochondrial-maintenance genes across three Neanderthal exomes found no broken gene and no enrichment, with one untested candidate, POLG Leu580Pro, worth a laboratory test.
9. "The permanent changes were undercounted"
Last, because the measurement error in this literature runs the other way. Jeanson's 63 mutations include 28 cases where the mother carries a variant and the child does not: reversions to the exact reference base, 403 times more than his own rate permits. That is the signature of genotype-calling noise at low coverage, and it inflates rather than deflates. Fixed changes are also the easiest thing in the molecule to detect; a 20% heteroplasmy threshold affects heteroplasmy detection, not homoplasmy.
10. Variation already present in Eve
The cleanest young-earth model on paper: Eve, or the women on the Ark, carried more than one complete mitochondrial sequence, and the differences between today's deepest lineages were partly inherited rather than accumulated. If so, dividing all of today's differences by a mutation rate is the wrong calculation, because some of them never arose by mutation. No measurement refutes this.
It has to supply a great deal. At a representative rate of lasting change of 0.009 per genome per generation, 6,000 years produces about 2.2 changes per branch, so about 54.9 of the 57.1 would have to be inherited: 96% of the depth.23 Sorting is no obstacle. An exact neutral calculation that starts with two equally common sequences in one mother and follows one maternal line shows how fast a mixture resolves:
| Effective units in the bottleneck | Still mixed after 10 generations | Still mixed after 240 generations | Eventual chance that either starting sequence wins |
|---|---|---|---|
| 2 | 0.098% | effectively zero | 50% |
| 10 | 46.5% | effectively zero | 50% |
| 32 | 94.9% | 0.070% | 50% |
So the rarity of heteroplasmy today does not, by itself, rule out inherited variation long ago.23 The table also shows the limit of the bottleneck argument: a narrower bottleneck makes sorting faster, but never raises a sequence's eventual chance above its starting frequency.
What limits it: three things, and two of them are new. First, two starting sequences give two backgrounds, not a branching tree; a richly branching tree needs many starting sequences with their variants linked correctly on whole molecules, or later mutations, and allowing arbitrary created sequences can fit any diversity, so the diversity no longer dates anything. Second, the deepest branches look exactly like mutation. A mitochondrial mutation is a transition, A to G or C to T, about 95% of the time, while an arbitrary base difference would be a transversion two times in three. Sorting every substitution in PhyloTree Build 17 by its depth below the root, the first 30 below the root are 95% transitions, the same as the tips, and the control region, which codes for no protein, shows the same bias, 91%, in its deepest changes.115 So created variation fits the data only if it was made to imitate mutation's base-change pattern at every depth. That is a coherent theological claim, but it is no longer a scientific prediction. Third, a creationist has already tested a version of this and rejected it. Todd Wood, analysing horse, cat and dog mitochondrial DNA, considered heteroplasmy on the Ark sorted into different lineages and concluded: "Since the broad intrabaraminic relationships inferred from morphology do reflect mtDNA similarity, this relict mtDNA hypothesis can be ruled out, and instead, the hypothesis of rapid mtDNA divergence is supported."116
11. A burst of mutation after the Flood
The strongest young-earth model on file, stated in a creationist's own words. Wood's conclusion from the same three animal groups: "the similarity of aDNA from Pleistocene specimens to modern mitochondrial DNA implies a rapid sequence diversification from the time of the Flood to the time the fossils were formed. Since then, DNA divergence has been low, since these ancient sequences closely resemble their extant counterparts. Thus, these results imply a period of rapid genetic divergence after the Flood that quickly decreased to the low mutation rates characteristic of the present."116 Note what Wood concedes: the present rate is low. He does not use a pedigree arising rate as the clock, which is the opposite of Jeanson's move and agrees with the joint this article turns on.
What it needs: producing all 57.1 changes in 500 years needs about 2.86 lasting changes per genome per generation, 317 times a representative modern rate of 0.009; spread over 1,500 years it needs 0.95, 106 times.23 The burst must also fall while the lineages are splitting, because a change made before two lines part is shared by both and creates no difference between them.
Why it ranks first: a mechanism of that size is known. A proofreading-dead mitochondrial polymerase in mice makes 2.5 to 7.5 lasting changes per generation in the germline, enough to produce the whole depth in 8 to 23 generations, as the mechanism section prices it.85
What limits it: everything except size. No evidence says it happened. It would have to run in every surviving maternal line at once, Neanderthals and Denisovans included, to the same degree, since their branches measure 1.01 and 0.96 of ours, and then disappear without leaving the allele in any living population. It carries a cost: inherited mutator mutations aggravate ageing and lower fertility over generations in mice.86 A burst common to every lineage only rescales time, so only dated samples can see it, and those see no burst: Rieux's 21 single-sample calibrations agree within 3.2% from 2,535 to 39,464 radiocarbon years, so the mitochondrial rate would have to fall in step with whatever inflated the radiocarbon ages, two unrelated processes following one curve. Ötzi, anchored by tree rings, caps the rate since his death. Wood himself notes that his own recalibration places four Pleistocene specimens at the Flood itself, and "cannot be precisely correct."116
What the ceiling comes to
Take every real mechanism at its generous end. Maternal age and generation time push against each other, so the pair yields perhaps 2-fold unless the maternal extrapolation to age 100 is granted in full, in which case it is the dominant term. The bottleneck adds at most 3-fold and cannot be stacked on a deCODE baseline.
Granting the full eighteen-fold maternal extrapolation, a young-earth model clears the 4-fold and 10-fold versions of the problem and approaches the 40-fold one. Refusing it leaves a ceiling near 4- to 6-fold, which clears the most generous baseline and nothing else.
The grounds for refusing it are now stronger than they were. When this section was first written the case against the extrapolation was that no data existed past a mother's mid-forties, that the exponential shape was a software default rather than a result, and that Genesis records no maternal ages. All three still hold. Added to them is a direct measurement in human eggs that finds no age effect at all. A rescue whose mechanism has been looked for in the right cell type and not found is not a rescue that can be granted at full strength.
That is where the argument stands for the mechanisms that multiply today's rate, and it is a narrower disagreement than either side's rhetoric suggests. It turns on the shape of one curve past the end of its data, and on whether the women of the early post-Flood world bore children at ages the text never records.
The two whole-history models are not capped this way. A burst after the Flood can be as large as needed, and a known mechanism reaches the needed size; inherited variation can supply any depth. What they lack is evidence that they happened and a fitted model that reproduces the tree, the ancient genomes and the family counts together. That is a narrower and more productive young-earth question than the clock argument usually asked: not "is the rate fast?", which the data answer, but "what happened once, and what trace would it have left?"
Objections
1. "The phylogenetic rate is circular, because it assumes the human-chimp split."
Half right, and the half that is right is worth conceding loudly. Ingman 2000, Horai 1995, Mishmar 2003 and Soares 2009 are all calibrated on an assumed ape divergence, and none of them can be offered as independent evidence for deep time.
But the tip-calibrated rates use no ape at all, and they agree with the chimp-calibrated ones to within 20 to 25%. And the Norfolk Island result uses no calibration whatsoever: it is a count of permanent changes in a documented family tree. Depending on a calibration is not circular by itself; the circularity section says where the line falls.
2. "Selection can't be the answer, because the studies only sample healthy adults."
Carter's argument, and the best one available, but it addresses the wrong stage. The measurements showing ongoing removal are of variation inside healthy sampled people: 10% of possible protein-changing variants present against 55% of silent ones, and a changing-to-silent ratio that declines with branch age. Selection during egg formation, before any individual exists to be sampled, has been demonstrated experimentally in mice and observed in human primordial germ cells. More decisively, the argument is moot: Norfolk Island measures the fixing rate directly and gets the phylogenetic answer without invoking selection at all. Kimura's objection gives the details.
3. "Heteroplasmy clears up in deep genealogies, so it's a minor problem."
Right in principle, which is exactly why it is testable, and rescue 6 above is that test. Excluding heteroplasmy, Norfolk Island gives 1.30 × 10⁻⁸ per site per year; including it, 5.85 × 10⁻⁸. That 4.5-fold difference is the entire disputed effect, measured.
4. "Ancient DNA is too degraded to trust."
Damage adds spurious variants, which makes ancient branches look longer and the rate look slower. It biases toward an older Eve, not a younger one. Transversion-only counts, which deamination cannot produce, preserve the archaic distances: on average 4.12 transversions separate two living humans, 11.81 a human from a Neanderthal and 20.66 a human from a Denisovan, about 2.9 and 5.0 times the human figure.65 And four of thirty genomes in one study failed a damage screen and were discarded, so the screening is real.
5. "Mutation rates might have been faster in the past."
This is not refutable in principle, and an honest article should say so. What can be said is that it must be large, 21 to 34 times the long-term rates against Fu's, Rieux's and Soares' figures; that it must have run on every surviving maternal line at once, Neanderthals, Denisovans and our own ancestors alike; that it must have stopped before the dated ancient genomes, which show no trace of it; and that the same claim applied to the penguin, bison and cattle datasets would break clocks that currently work. The strongest version is a single burst just after the Flood, which rescue 11 prices: a mechanism of the needed size now exists, in mutator mice, but nothing shows it operated.
6. "Modern nutrition, sanitation and medicine could have slowed the rate the pedigree studies measured."
Every pedigree measurement in this article was made in a modern or recent population. Connell's Norfolk Island transmissions are largely twentieth-century; deCODE's Icelanders are contemporary. Nobody has ever measured a germline mitochondrial rate by pedigree in a population without antibiotics, sanitation or reliable food. That gap is real and the objection deserves better than a wave. Four answers, in ascending order of force.
The one measured lever runs the wrong way. The best-established modulator of germline mitochondrial mutation is maternal age: older mothers transmit more.34 Modern women have children later than historical women did. A modern sample should therefore give a faster rate than a historical one, not a slower one.
The one real environmental-insult experiment found nothing where it counts. Forster and colleagues compared families living on high natural background radiation in Kerala against families on low background: 22 new heteroplasmies in 595 transmissions against 1 in 200, a 7.4-fold elevation from a genuinely severe exposure. None of the 23 was fixed.81 If ionising radiation raises the arising rate sevenfold and the fixing rate not at all, diet and sanitation will not move the fixing rate by the factor of 21 to 34 this objection needs.
The biology limits the exposure window, and harsher conditions would push the wrong way. A woman's oocytes form and arrest before she is born, and the mitochondrial DNA that reaches her children has largely stopped replicating by then. Lifetime diet and infection load act mostly on somatic tissue, which is why Zaidi's and Wei's designs require a variant to appear in two separate tissues before it counts as germline. Meanwhile higher infant and child mortality means stronger removal of mutation-laden offspring before they reproduce; deCODE documents "the impact of negative selection on viable deleterious mutations" and "pre-natal selection that most likely occurs during the development of oocytes."12 The young-earth version of this objection, that hard living speeds the clock, may have the sign backwards for the quantity that matters.
The historical rate has been measured directly, and it is not elevated. Ancient DNA reads the rate off people who had no sanitation, no antibiotics and no modern nutrition. This article's own regression on 229 radiocarbon-dated genomes spanning 1,475 to 37,985 years gives 2.58 × 10⁻⁸ per site per year;61 the published tip-calibrated rates run 2.1 to 2.8 × 10⁻⁸. Those are pre-modern people, ticking at essentially the modern rate. If pre-modern life ran the mitochondrial clock twenty or thirty times faster, 229 ancient genomes would show it. They do not.
State the qualification with it, because the objection deserves the strongest form of the reply and the weakest form of the evidence. That regression is carried by its oldest samples, and restricted to the last 10,000 years it can no longer separate one slow rate from another. What it still does inside that window is exclude a rate fifteen times faster, which is what this objection needs.
7. "Mitochondrial DNA is only one locus — it can't settle anything."
Correct, and it cuts both ways. A single-locus date carries roughly a sevenfold 95% spread even under the standard model. This article does not claim mitochondrial DNA settles human origins. It claims something narrower: that the specific young-earth argument built on the pedigree mutation rate does not work, for reasons internal to mitochondrial genetics.
8. "Rohde, Olson and Chang showed the common ancestor of everyone lived a few thousand years ago."
They did, and it is a genuinely underused mainstream result: a Nature paper putting the universal genealogical ancestor of all living humans somewhere between 1415 BC and AD 55, and the point at which everyone alive shares an identical set of ancestors between about 5300 and 2100 BC.117
But it is about genealogical ancestry, not genetic ancestry, and the paper says so. Jan Hein's accompanying commentary is blunt: such an individual "might have contributed nothing" genetically.118 This result does not support a young mitochondrial Eve, and using it that way would be a misuse. It does establish that "everyone descends from one recent person" is not intrinsically absurd.
9. "Even if the mitochondrial argument fails, the Y chromosome / population size arguments survive."
Those are separate questions with separate evidence, and they have their own articles on this site: Y-chromosome Adam, Population bottlenecks and Population genetics. Nothing here settles them.
10. "Rejecting the fast clock means accepting every conventional date."
No. A rate can fail to date Eve while the conventional estimate also carries real uncertainty. Calibration, the reconstructed root, selection, sites that mutate repeatedly and population history all move the answer, and this article prints the spread: the whole-tree rates of lasting change give 126,000 to 265,000 years, one clade and one age bin give 39,000 and 80,000, and Connell's own interval runs from 73,000 to over a million. Endicott and Ho moved Eve from 162,000 to 108,000 years by swapping calibrations on the same data. A model can be better supported than its rival without every point estimate being exact.
11. "Eve could have carried more than one mitochondrial genome."
Yes, and that is a coherent hypothesis that no measurement refutes. The neutral sorting table in rescue 10 shows her descendants need not stay heteroplasmic today. The open question is whether a restricted, independently justified set of starting sequences can reproduce the actual tree in the time available, and two findings make that harder: the deepest branches carry the same transition bias as recent mutations, and Todd Wood, testing the same idea in animals, ruled it out. Choosing enough arbitrary starting sequences can fit any tree, which also makes the history untestable.
Open research questions
These are the measurements and models that would move this question, for either side.
- Fit the family observation process. Reanalyse the Icelandic and Norfolk data with their actual pedigrees, tissues, coverage and detection rules, and estimate the rate of inherited lasting changes directly, rather than dividing a raw detection count by a chosen correction. Test the fitted model on families held out of the analysis.
- Fit a constrained founder-sequence model. Specify the number, sequences and frequencies of the starting mitochondrial sequences, generate descendant trees with measured transmission behaviour, and test whether the same parameters reproduce living diversity, the ancient genomes and the transition bias of the deepest branches.
- Fit a burst model the same way. Specify when a post-Flood mutator ran, in whom, and for how long, and predict the branch lengths, the mutation spectrum and the dated ancient genomes before comparing them with the data.
- Test POLG Leu580Pro. Measure error rate, mutation spectrum, processivity and copy number in matched systems with one and two copies, and follow a positive result with transmission experiments.
- Measure maternal age in eggs and descendants together. Combine high-sensitivity egg work with multigeneration families, separate mutation, drift and selection, and fit straight, curved and plateau models within the observed ages before extrapolating.
- Fit dated human, Neanderthal and Denisovan trees. Replace the distance baselines with a partitioned phylogeny that uses each specimen's own age, shared ancestry and sequence quality, and compare constant-rate, burst and inherited-variation histories on the same data.
- Separate site classes before pooling rates. Fit control-region hotspots, silent changes, amino-acid-changing sites and RNA genes separately. A proposed acceleration should predict which classes speed up.
- Close the remaining source gaps. The Parsons 1997 sentence, the caption-derived interview quotations and the early critiques of Cann 1987 are listed in the quarantine page until a primary text or recording is checked.
A study that did any of these would have a publishable result either way. The present evidence does not establish a 6,000-year Eve, but it leaves a narrower and more productive young-earth question: whether specified inherited variation, or a specified and evidenced burst, can explain the same data without the unsupported rate conversion of the familiar fast-clock argument.
What this article claims, and what it does not
It claims:
- The pedigree-versus-phylogenetic discrepancy is real, mainstream, and was not manufactured by creationists.
- The discrepancy is largely explained by the difference between mutations appearing and mutations becoming permanent. One generation shows the gap (Wei's 477 new low-level variants against 3 near-fixed ones), though a snapshot cannot say how many of the 477 eventually became permanent.
- The young-earth calculation substitutes the appearing rate for the fixing rate, and when the fixing rate is measured directly in a deep human pedigree the result matches the phylogenetic rate.
- Three maternal founders at the Flood do not predict a three-way root, and the two-way root refutes only Jeanson's 2016 reading of three nodes. What fails is branch length: founders at the deepest nodes need 10 to 14 pre-Flood mutations, and measured rates supply 0.5 to 3.9 in 1,656 years.
- The archaic hominin distances have no measured young-earth explanation on file, and the leading young-earth author says so in print. The open routes are inherited variation, a post-Flood burst, for which a mechanism of the right size exists in mutator mice, and the untested POLG Leu580Pro candidate; none has evidence that it happened.
It does not claim:
- That mitochondrial DNA establishes 150,000 years with precision. It does not; the single-locus spread is roughly sevenfold, the whole-tree rates of lasting change give 126,000 to 265,000 years, and one clade, one age bin and the lower end of Connell's interval reach 39,000 to 80,000.
- That the pedigree measurements are wrong. They are right, and they measure something real.
- That the deCODE-rate answer of about 24,000 years is correct. It is what you get by extrapolating a short-term rate too far, and it is quoted here to show that both sides are doing exactly that.
- That any of this settles the age of the earth, the existence of a historical Adam and Eve, or human origins generally. One locus does not carry that weight.
The verdict: the data do not support a 6,000-year mitochondrial Eve. The argument is not stupid, its central observation is correct, and its authors are working with real numbers from real papers. It fails at one specific joint, the substitution of the rate at which mutations appear for the rate at which they last, and that joint can be tested directly, without any assumption a young-earth reader disputes. It has been tested: 54.6 lasting changes expected on Norfolk Island, two seen. Under the simple counting model that is a probability of about 3 in 1021, and no plausible correction to the counting closes a gap that size. What remains open to a young-earth model is not a faster clock but a different history, inherited variation or a one-time burst, and neither has yet been shown to have happened.
Companion pages
- Mutation rates and implied ages: the region-matched rate tables in full, with the method, the fossil-age check and the superseded conversions kept for auditing.
- Measurements: the studies with their event classes, sample sizes and what each number can support.
- The literature: every source this article rests on, with what it measured, in which units, how it was calibrated, and which way it cuts.
- Quotations and the quarantine page: verified excerpts, and the quotations held back until they can be checked.
- Related articles: Y-chromosome Adam, Adam, Eve and human genetic diversity, Neanderthals and Denisovans, Denisovans, Archaic admixture, Population genetics, and the overview, Human genetic ancestry.
Sources
- 1.
Gibbons, Ann. “Calibrating the Mitochondrial Clock.” Science 279(5347):28–29. Jan 2, 1998. A news article in Science, written after a 1997 workshop on human mitochondrial DNA mutation rates. It reports that two studies suggested mitochondrial DNA mutates as much as 20-fold faster than assumed, and that forensic scientists changed their identification rules because of it. The article uses it for the full passage about 'mitochondrial Eve' and six thousand years, and for the point that the discrepancy was taken seriously by scientists rather than invented by creationists. Mirror: Dnai.org ↩
- 1a.
The passage in full. The paragraph break is shown as ¶, as printed. “Regardless of the cause, evolutionists are most concerned about the effect of a faster mutation rate. For example, researchers have calculated that 'mitochondrial Eve'--the woman whose mtDNA was ancestral to that in all living people--lived 100,000 to 200,000 years ago in Africa. Using the new clock, she would be a mere 6000 years old. ¶ No one thinks that's the case, but at what point should models switch from one mtDNA time zone to the other?” ↩ ↩
- 1b.
The article opens on the discrepancy as a live problem, saying that mitochondrial DNA. “mutates much more often than previously estimated — as much as 20-fold faster, according to two studies that are causing a stir.” It also records the dissent. “'This is all a fuss about nothing,' says Oxford University geneticist Martin Richards, who thinks the fast rate reaches back hundreds of years at most.” ↩
- 1c.
“Therefore, Parsons and Holland, in their work identifying 220 soldiers' remains from World War II to the present, now have new guidelines--adopted by the FBI as well—to account for a faster mutation rate. When a missing soldier's or criminal suspect's mtDNA comes up with a single difference from that of a relative or at a crime scene, the scientists no longer call it a 'mismatch.' Instead the results are considered 'inconclusive.' And, for now, so are some of the evolutionary results gained by using the mtDNA clock.” ↩
- 1d.
The same article reports the two contemporaneous studies that found no elevated rate, Stoneking's work on Tristan da Cunha and Gyllensten's on 33 Swedish families. Most creationist citations of this source omit them. ↩
- 1a.
- 2.
Parsons, Thomas J. et al. “A high observed substitution rate in the human mitochondrial DNA control region.” Nature Genetics 15(4):363–368. Apr 1997. A genetic study that sequenced 610 base pairs of two hypervariable segments (HV1 and HV2) of mitochondrial DNA directly in 327 mother-to-child transmissions, not by RFLP analysis as one online rebuttal says. It found a substitution rate of 2.5 per site per million years, about 20 times the rate predicted by phylogenetic analyses. The article uses it because its authors worked out the age that this fast rate gives, about 6,500 years, and called it clearly incompatible with the known age of modern humans. ↩
- 2a.
Section Abstract: “Ten substitutions were observed, resulting in an empirical rate of 1/33 generations, or 2.5/site/Myr. This is roughly twenty-fold higher than estimates derived from phylogenetic analyses.” ↩ ↩
- 2b.
The authors' own calculation of the age of the most recent common maternal ancestor that their pedigree rate implies, about 6,500 years, and their verdict that it is incompatible with the known age of modern humans. They add that the ancestor of mitochondrial DNA may be younger than the ancestor of modern humans, but that a migration within the last 6,500 years still cannot explain where mitochondrial variants are found today. ↩
- 2c.
“Sequences derived from blood samples detected eight substitutions within 153 generations, whereas sequences derived from cell lines revealed two substitutions in 174 generations.” ↩
- 2a.
- 3.
Carter, Robert W. “When did Eve live? An evaluation of the data.” Creation Ministries International. Sep 18, 2025. A popular article on the Creation Ministries International website by Dr Robert Carter, published 18 September 2025 and headed "Biblically, about 6,000 years ago. Scientifically, the answer depends on the mutation rate." It is Carter's current young-earth statement on the date of Mitochondrial Eve, and it concedes that the published pedigree rates are too slow for his timeline. His separate peer-reviewed 2007 paper, "Mitochondrial diversity within modern human populations," in Nucleic Acids Research 35(9):3039–3045, https://pmc.ncbi.nlm.nih.gov/articles/PMC1888801/, is real and sound and does not date Eve; it locates the consensus of 827 sequences at the root of macrohaplogroup R and concedes "perhaps as few as 30 differences between the macrohaplogroup R consensus and the root node of all extant human mitochondrial sequences." The article cites it as the current young-earth statement on the question and quotes its concessions. ↩
- 3a.
“Ten years later, a study done on the population of Norfolk Island calculated a rate closer to 0.03 mutations per generation. This equates to one mutation every 33 generations, or about one every 1,000 years. Another study done on the population of Iceland detected 8,199 mutations among 116,663 mother-child transmissions, which equates to a rate of 0.07 mutations per generation, about twice as fast as the Norfolk Island population. These rates are a bit too slow for the creationist (we'll deal with that later) and a bit too fast for the evolutionist.”. His six "appeals" section works through selection, drift, male dead ends, heteroplasmy, somatic mutations and hypervariable sites. The drift argument is the strongest thing in the piece. Carter derives that the neutral substitution rate equals the neutral mutation rate, r = Nμ/N = μ, which is correct standard population genetics. The reply is that Kimura's identity takes as its input the rate at which mutations become heritable variants in an individual, and for mitochondrial DNA a new variant must first take over inside the mother's own germline before it is one. The heteroplasmy layer sits underneath the population-genetic layer, and the identity does not reach into it. His next appeal concedes the test: “when a genealogy is deep enough, heteroplasmy clears up”. Norfolk Island is a genealogy deep enough. ↩ ↩
- 3b.
Endnote 10 of Carter 2025 is quoted in full, and endnote 11 applies the identical formula to Madrigal 2012: “1.24e-6 µ/site/year x 16,569 sites x 30 years/generation x 2 … They also only studied the control region.” Howell's figures all come from Howell's own paper (Howell 2003). The Table 2 pooled row reads: “28/2633 / .95 / .53–1.57”. Its footnote defines the rate as: “2 × (Mutations/control region bp/Myr)”. Its methods sentence says: “we make the conservative assumption that there are 1,122 bp in the noncoding control region … It is also assumed that there are 20 years per generation”. The coding-region result is: “we obtain 4 mutations/462 transmission events, or a rate of 0.06 mutations/bp/Myr (99.5% CI 0.008–0.20)”. Note what the last of these means for the criticism: the coding-region measurement Carter needed was in the paper he was citing, so the approximation his endnote apologises for was not necessary. “The data do not allow for a more accurate estimate”. For contrast, his Connell endnote is correct, and correctly omits the doubling, because Connell measured the whole molecule: “0.058e-6 µ/site year x 16,569 sites * 30 years/generation”. ↩
- 3c.
“The reported 'genealogical' mtDNA mutation rates are a bit too slow for the creationists.” He then proposes a mechanism he calls 'Patriarchal Drive' to close the gap. Diagnosed as the unit error described in the article, the gap he is trying to close does not exist. ↩
- 3d.
“Importantly, they had no way of predicting Eve's existence before they discovered her. Instead, once the concept of a single human female ancestress became obvious (from various genomics analyses), a 'bottleneck' was added to the evolutionary model, post facto.” Against this, Avise, Neigel & Arnold published the prediction in 1984. Cann et al. 1987 treated a bottleneck as an open question for future testing rather than an assumption, and Wilson said in 1988 that the result was not surprising to statisticians. The same article contains a citation error, attributing the "discovery" of mitochondrial Eve to Anderson et al. 1981, which is the paper that sequenced one human mitochondrial genome and made no claim about a common ancestor. ↩
- 3e.
“Option 3 raises an interesting question. How many lines would we expect to see? Depending on how closely related they were, there could have been 1, 2, or 3 mitochondrial lines among Noah's daughters-in-law. Thus, it is entirely possible that every mutation in the tree occurred post-Flood. The fact that there is no obvious three-way split in the tree tells us something important.” He does not then say what it tells us. He also concedes: “Most people don't realize it, but we cannot know upon which branch Eve sits on the mtDNA family tree.” ↩
- 3f.
“It must be emphasized that lethal mutations cannot appear in the studies listed above. The people sampled were all healthy adults. The scientists would also have avoided people with mtDNA mutations that cause metabolic diseases… What I am saying is that natural selection has nothing to do here. It has already done its work by the time a person appears in a genetic study. That being so, one cannot invoke selection to slow down the genealogical mutation rate, for this rate is calculated after most of the selection has been performed.” The measurements in Kivisild 2006, Laricchia 2022, Fan 2008, Floros 2018 and Árnadóttir 2024 are all of variation within healthy sampled people, or of selection acting during egg formation before any individual exists to be sampled. None of them is touched by this argument. ↩
- 3a.
- 4.
Wei, Wei et al. “Germline selection shapes human mitochondrial DNA diversity.” Science 364(6442):eaau6520. 2019. A genetic study that sequenced 1,526 mother-offspring pairs and counted the new heteroplasmies in each child. Supplementary Table S2 lists 13 de novo D-loop variants, but the rate printed on the same row requires 131; every other row is exactly consistent with n = 1,526, and this one implies n = 151. It is a dropped digit. The article uses it as its main direct comparison of mutations appearing with mutations staying. Mirror: Repository.cam.ac.uk ↩ ↩ ↩
- 4a.
477 de novo heteroplasmies above a 1% threshold across 1,526 transmissions, against only 3 de novo variants above 80% heteroplasmic fraction, two of which the authors attribute to ascertainment bias. Both counts are taken in the children of one generation: a snapshot of frequency, not the eventual fate of the 477. ↩ ↩
- 4a.
- 5.
Connell, Jennifer R. et al. “Pedigree derived mutation rate across the entire mitochondrial genome of the Norfolk Island population.” Scientific Reports 12:6827. 2022. A pedigree study that sequenced the complete mitochondrial genome of 225 individuals from 45 maternal lineages in the documented Norfolk Island genealogy, covering 345 mother-child transmissions, and found nine changes, seven of them heteroplasmic (a variant present in only some of a person's mitochondrial copies) and two fixed changes. Counting all nine gives 0.058 mutations per site per million years; excluding the seven heteroplasmic changes gives 0.013, that is 1.30 × 10⁻⁸ per site per year, against the phylogenetic 1.665 × 10⁻⁸. Jeanson's rate of 0.158 per generation predicts 54.6 fixed changes in 345 transmissions, and the probability of observing 2 or fewer is about 3 × 10-21; this is the cleanest direct measurement of the whole-genome fixing rate in a deep human pedigree and the most important source in the article. ↩ ↩ ↩ ↩ ↩ ↩ ↩
- 5a.
Section Abstract: The abstract gives the all-inclusive rate of 0.058 mutations per site per million years (95% CI 0.031-0.108). Section Results: The 0.058 figure is the all-inclusive rate; the paper's Table 2 gives the fixed-only figure as 0.013 mutations per site per million years (95% CI 0.003-0.047) in the very next sentence. ↩ ↩
- 5b.
Section Discussion, Mutation rate: “In this study, the rates calculated for the NI population included all mutations (heteroplasmy, germline, somatic). In contrast, for the HVI region, Santos et al. reported a mutation rate of 0.074 mutations/site/Myr … however their rate only included substitutions (including heteroplasmy) with a germinal origin present in women fixed at the individual level.” Table 3: The table's footnote key labels every row by inclusion criterion. Footnote e, which is attached to every Norfolk Island row, reads: “All the substitutions (including heteroplasmy) that were detected were considered.” ↩
- 5c.
Section Discussion: Table 2 gives the Norfolk Island hypervariable-region-1 rate as 1.201 and Table 3 gives Santos's as 0.074, so 1.201 ÷ 0.074 = 16.2. Santos et al. 2005 is a pedigree study of Azorean families, not a phylogenetic analysis. A coincidence probably contributed to the slip: 0.074 is also the standardised value of the one phylogenetic hypervariable-region-2 rate in the same table (Horai 1995's 7.39 × 10⁻⁸ per site per year), so the same figure appears twice in Table 3 under two different methods. ↩
- 5d.
Section Conclusion: Their complete-mtGenome block in Table 3, standardised to a 25-year generation, contains: Norfolk Island 0.063, Fu 2013 (ancient DNA) 0.019, Rieux 2014 (ancient DNA) 0.021, Brotherton 2013 (ancient DNA) 0.024, and Rebolledo-Jaramillo 2014's fixation rate 0.011; and no phylogenetic entry. The region-by-region pedigree-versus-phylogenetic ratios that are in the table are 12.5x for hypervariable region 1 (1.292 against Horai's 0.103), 7.2x for the control region (0.505 against 0.070), 5.0x for hypervariable region 2 (0.369 against 0.074) and 1.8x for the coding region (0.030 against Ingman 2000's 0.017). None is 16, and all of them use the all-inclusive Norfolk Island numerator. ↩
- 5e.
Section Methods: “Genealogical records for a sample of 222 individuals from Norfolk Island suggest that the average maternal intergenerational time is 26.9 years.” ↩
- 5a.
- 6.
Soares, Pedro et al. “Correcting for Purifying Selection: An Improved Human Mitochondrial Molecular Clock.” American Journal of Human Genetics 84(6):740–759. 2009. “one mutation every 3624 years”. “a severe shortage of such uncontroversial episodes”. A study that recalibrated the human mitochondrial clock for the whole molecule, using more than 2,000 complete mitochondrial genomes. Its rate of 1.665 × 10⁻⁸ substitutions per nucleotide per year is calibrated on an assumed 6.5–7 million-year human-chimpanzee split, so it is a model output rather than a measurement, and the young-earth circularity critique is correct about this paper specifically. The paper also concedes that there are few uncontroversial episodes available for archaeological calibration. The article uses it for the phylogenetic rate that the young-earth argument has to overturn, and for the size of the selection correction, which the paper's own curve puts at 1.50 times at 0–1 thousand years falling to 1.13 times at 50–100 thousand years. ↩ ↩ ↩ ↩ ↩ ↩
- 7.
Budowle, Bruce et al. “Interpretation Guidelines for Mitochondrial DNA Sequencing.” Proceedings of the Tenth International Symposium on Human Identification. Promega. 1999. “If the questioned and known samples differ by a single nucleotide, and no evidence of heteroplasmy is present, the comparison should be reported as inconclusive.” A conference paper by authors from the FBI Laboratory Division, setting out how to report mitochondrial DNA comparisons. The rule concerns identity comparisons between two specimens and has nothing to do with the age of mitochondrial Eve. The article uses it to show that Gibbons's account of the FBI's rule change is accurate. ↩ ↩
- 8.
Madrigal, Lorena et al. “High mitochondrial mutation rates estimated from deep-rooting Costa Rican pedigrees.” American Journal of Physical Anthropology 148(3):327–333. 2012. A pedigree study of 19 deep-rooting genealogies from Costa Rica, covering 289 meioses (transmissions from parent to child), that found 7 mutations in hypervariable region I, the fast-changing part of the control region. The paper uses a measured female generation interval of 28.3 years, which is worth noting against the 15 years the young-earth calculation requires; its abstract headline rate of 1.24 × 10⁻⁶ per site per year could not be reproduced from its own Results or Table 2, which give 2.51 × 10⁻⁶ (maximum) and 0.89 × 10⁻⁶ (minimum). The article quotes its authors' caution that the fast and slow estimates should both be considered. ↩
- 8a.
“Our results confirm that mutation rates observed in pedigrees are much higher than estimated assuming a neutral model of long-term HVRI evolution. We argue that, until the cause of these discrepancies will be fully understood, both lower estimates (i.e., those derived from phylogenetic comparisons) and higher, direct estimates such as those obtained in this study, should be considered when modeling evolutionary and demographic processes.” ↩
- 8a.
- 9.
Ingman, Max et al. “Mitochondrial genome variation and the origin of modern humans.” Nature 408(6813):708–713. 2000. “has not evolved at a constant rate across all human lineages”. “consequently less suitable for dating evolutionary events”. A genetic study of 53 complete mitochondrial genomes, the whole molecule, from people around the world. The mean pairwise difference over the whole molecule was 61.1 for all humans (n=53), 38.5 for non-Africans (n=32) and 76.7 for Africans (n=21), and the authors left out the D-loop, a control region, because it does not evolve at a constant rate. The article uses it for the rate that depends on an assumed 5-million-year human-chimpanzee split, and for its whole-genome sequences, which first re-established the African root. ↩ ↩
- 9a.
“From the mean genetic distance between all the humans and the one chimpanzee sequence (0.17 substitutions per site) and the assumption, based on palaeontological and genetic evidence, of a divergence time between humans and chimpanzees of 5 Myr, the mutation rate (μ) for the mitochondrial molecule, excluding the D-loop, is estimated to be 1.70 × 10⁻⁸ substitutions per site per year.” The 0.17 is a measurement; the 5 Myr is an assumption; the rate is a model output; and the 171,500-year date derived from it is a model output twice over. This is the clearest single illustration of the point the young-earth circularity charge gets right. ↩ ↩ ↩
- 9a.
- 10.
Kimura, Motoo. “Evolutionary rate at the molecular level.” Nature 217:624–626. Feb 17, 1968. A short theoretical paper in which Motoo Kimura estimated how fast DNA changes in mammals, from amino-acid differences in proteins such as haemoglobin, and found that one nucleotide pair is substituted in the population about every two years. He argued that a rate this fast could be sustained only if most such changes are almost neutral, meaning that selection neither helps nor harms them. The neutral result the article invokes is standard: for a strictly neutral variant, the long-run substitution rate equals the mutation rate independent of population size, because the N new mutants per generation and the 1/N fixation probability cancel. Robert Carter is right to insist on this against critics who answer the young-earth argument by gesturing at selection in general. The article uses it for this point, and says that mitochondrial sites are measurably not neutral, so the fixing rate can be measured directly anyway. ↩ ↩
- 11.
Thomas, Brian. “Mother of All Humans Lived 6,000 Years Ago.” Institute for Creation Research. Sep 7, 2010. The sentence reads. “No one thinks that's the case.” A web article by Brian Thomas for the Institute for Creation Research, published 7 September 2010, that quotes the Gibbons passage in full, including the sentence below. The article uses it as the counter-example to the claim that creationists uniformly truncate this source. ↩ ↩
- 12.
Árnadóttir, Erla R. et al. “The rate and nature of mitochondrial DNA mutations in human pedigrees.” Cell 187(15):3904–3918.e8. 2024. A study from deCODE Genetics/Amgen in Reykjavik of 64,806 Icelanders from 2,548 matrilines, with 116,663 mother-child transmissions and 8,199 mutations, which the article calls the largest such study ever run. The article gives the rate as 0.0703 mutations per genome per transmission. The article uses it as its direct measurement of the pedigree rate, divided into the measured depth of the human mitochondrial tree, which gives roughly 24,000 years. Mirror: Decode.com ↩ ↩ ↩ ↩ ↩
- 12a.
The same paper documents that the mutations are heavily concentrated at hypermutable sites which recur and revert, so the count cannot be extrapolated linearly. It also reports negative selection and pre-natal (oocyte) selection operating inside ordinary pedigrees. Both findings cut against using this rate as a long-run clock, including in the 24,000-year figure this article quotes from it. ↩
- 12b.
Section Results: The detection rule, from the Results: “we used a minimum read frequency threshold of 0.05 for detecting mutations in individuals, requiring at least one carrier to have a read frequency of ≥0.1.” The comparison with Connell, from the same paragraph. Reference 16 in their list is Connell et al. 2022, whose coding-region estimate is: “2.87 × 10⁻⁶ mut/bp/gen … or 9.79 × 10⁻⁸ mut/bp/year … is higher than a previously published pedigree-based estimate of 2.59 × 10⁻⁸ mut/bp/year, where a higher frequency threshold (0.2) was used for detecting mutation events.” The authors also measured their own false-positive rate against additional tissues: 3 of 284 for mutations with more than one carrier in a matriline, but 9 of 110 (8.2%) for mutations with only a single carrier. Single-carrier mutations are 69% of everything they detected. ↩ ↩
- 12c.
Section Discussion. Section Limitations of the study: The sentence from the Limitations section is the more important of the two: a study reporting 0.0703 mutations per transmission, telling its readers that the true germline mutation rate is higher than that, is telling them the number is not a fixation rate. ↩ ↩
- 12d.
Section Results: The comparison against Soares 2009: “In the control region, mutations involved markedly fewer (19.7%, p < 1 × 10⁻⁵) positions in matrilines than in the phylogeny and were more likely to affect the same positions multiple times (p ID 65.3% higher, p < 1 × 10⁻⁵). This difference is mainly driven by HVR1 and HVR2, where a substantial number of mutations at hypermutable positions are evidently missed in phylogenies such as the one from Soares et al., particularly on long branches.” This is a direct measurement of control-region saturation on 8,199 events, and it is the reason a control-region pedigree count cannot be extrapolated backwards. ↩
- 12e.
Section Discussion: “Previous studies of humans, based on the same methodology, but many fewer transmissions (typically across a single generation), have produced estimates of N e ranging from 2 to 32, with an average of 8.1 (Table S2). Even after excluding the outlying estimate of 32 (based on 39 M-C transmissions and primarily mutations at low heteroplasmy frequencies, which are likely to result in overestimates of N e), the average from previous studies becomes 5.7.” The outlier is Rebolledo-Jaramillo 2014. Their own estimate, from thousands of transmissions rather than one generation, is about 3. ↩
- 12f.
Section Results: “For mutations with more than one carrier in a matriline, 3 of 284 instances (0.011, 95% CI 0.002–0.033) were deemed absent from additional tissues, whereas for mutations with only one carrier in a matriline, there were 9 of 110 such instances (0.082, 95% CI 0.041–0.154). This indicates a low false-positive rate for the detection of germline mutations, albeit higher for those observed in only one carrier in a matriline (69% of detected mutations).” “with the exception of hypervariable region 2 (HVR2), are similar for branches with >1 descendant (where 2,540 of 3,197 mutations are supported by at least 2 carriers) and branches with only one descendant”. ↩
- 12a.
- 13.
Cann, Rebecca L. et al. “Mitochondrial DNA and human evolution.” Nature 325:31–36. Jan 1, 1987. A laboratory study of mitochondrial DNA, the small circle of DNA in the cell's energy organelles that is inherited from the mother. The authors cut DNA from 147 people in five populations with restriction enzymes, which split DNA at fixed sites, and found that all the sampled DNAs trace back to one woman who lived about 200,000 years ago, probably in Africa. The article uses it to show that the words 'Eve' and 'Adam' appear nowhere in the paper, and to set out the paper's own weak points. Mirror: Mun.ca ↩ ↩
- 13a.
“Mitochondrial DNAs from 147 people, drawn from five geographic populations have been analysed by restriction mapping. All these mitochondrial DNAs stem from one woman who is postulated to have lived about 200,000 years ago, probably in Africa.” ↩
- 13b.
“Each purified mtDNA was subjected to high resolution mapping with 12 restriction enzymes… In this way, we identified 467 independent sites, of which 195 were polymorphic (that is, absent in at least one individual). An average of 370 restriction sites per individual were surveyed, representing about 9% of the 16,569 base-pair human mtDNA genome.” ↩
- 13c.
“The minimum-length tree requires fewer changes at 22 of the 93 phylogenetically-informative restriction sites than does the population-specific tree, while the latter tree required fewer changes at four sites… The minimum-length tree is thus favoured by a score of 22 to 4.” ↩
- 13d.
“Only two of the 20 Africans in our sample, those bearing mtDNA types I and 81 (see below) were born in sub-Saharan Africa. The other 18 people in this sample are Black Americans, who bear many non-African nuclear genes probably contributed mainly by Caucasian mates.” Their defence, in the same paragraph, is that 12 of the 18 carried restriction-site markers known to occur predominantly in native sub-Saharan Africans. ↩
- 13a.
- 14.
Tierney, John. “The Search for Adam and Eve.” Newsweek 111:46–52. Jan 11, 1988. A feature article in a news magazine, published in January 1988, a year after the study of mitochondrial DNA. Its text quotes the study's authors and critics, including Allan Wilson on the word 'Eve'. The article uses it because the cover painting, a garden, a serpent and one couple, is the misleading part of the story, given that the text says she 'was not the only woman on earth'.
- 14a.
Speaker is Allan Wilson, quoted on page 5 of the text, whose page count is not the magazine's pages 46–52. “"There must be one lucky mother," Wilson says. "I worry about the term 'Eve' a little bit because of the implication that in her generation there were only two people. We are not saying that. We're saying that in her generation there was some unknown number of men and women, probably a fairly large number, maybe a few thousand."” ↩
- 14a.
- 15.
Wieland, Carl. “A shrinking date for 'Eve'.” Journal of Creation 12(1):1–3. Apr 1998 (edition of 2006). A short article by Carl Wieland, first printed in the Journal of Creation in April 1998 and reposted on creation.com on 29 January 2006. Its subtitle says that mitochondrial DNA supports the Bible timeframe and descent of all people from Eve. The article also cites his 2006 reply to MacAndrew, https://creation.com/en/articles/cmi-responds-to-sceptics-criticism-of-mitochondrial-eve-article. The article uses it for two points: the mitochondrial Eve data is consistent with the Bible without proving it, and the one-ancestress result was not expected by evolutionists.
- 15a.
“Evolutionists do not claim, nor can it be fairly stated, that this evidence proves that there was only one woman alive at any point in the past. Holders to the 'Eve' theory certainly insist that all modern humans are indeed descended from one woman. However, they believe that there were other women present at the time, and that any of these other women could have contributed DNA information to our present gene pool of humanity.” “The mitochondrial Eve data does not force the belief that there was only one woman from whom we all descended—in other words, it doesn't prove the Bible—but—a very important 'but'—it is most definitely consistent with it.” An accurate statement of the coalescent, and the reason this article does not accuse creationists in general of the "only woman alive" error. ↩
- 15b.
“And it was not something that was expected by evolutionists.” Avise, Neigel & Arnold 1984 predicted exactly this outcome for stable populations three years before Cann et al. 1987. ↩
- 15a.
- 16.
Avise, John C. et al. “Demographic influences on mitochondrial DNA lineage survivorship in animal populations.” Journal of Molecular Evolution 20(2):99–105. 1984. “For stable-sized populations initiated by n females and/or regulated about carrying capacity k = n, it is highly probable that within about 4n generations all descendants will trace their ancestries to a single founder female.” A simulation study of how lines of mitochondrial DNA, which pass only from mother to child, survive in animal populations of stable size. It found that a population started by n females has all its descendants trace back to one founding female within about 4n generations. The article uses it because it was published three years before the 1987 Eve paper, so the claim that mitochondrial Eve was not expected by evolutionists can be dated and refuted. ↩
- 17.
Mendez, Fernando L. et al. “An African American paternal lineage adds an extremely ancient root to the human Y chromosome phylogenetic tree.” American Journal of Human Genetics 92(3):454–459. 2013. A genetic study that sequenced about 240 kb of the Y chromosome, the male sex chromosome, from one African American man, a lineage that had not been sampled before. The sample came from a large database of consumer DNA tests of African Americans, and several authors work for Family Tree DNA, a commercial genealogy company. One lineage found in one man moved the estimated age of the Y-chromosome common ancestor from about 138,000 to 338,000 years (95% confidence interval 237,000–581,000 years), and the article cites it only to show that a single-locus common ancestor depends on the sample as much as on history. ↩
- 18.
Barinaga, Marcia. “'African Eve' backers beat a retreat.” Science 255(5045):686–687. Feb 7, 1992. “African origin of human mitochondrial DNA reexamined”. A news report in Science, not a research paper, on the 1991–92 technical exchange that undermined the African root of the mitochondrial tree. It names the papers behind the retreat: Maddison in Systematic Zoology 40(3):355–363 (1991), and A. R. Templeton in Science 255(5045):737 and S. B. Hedges and colleagues in Science 255(5045):737–739 (both 1992). The article cites it for the existence and framing of this retraction, which it does not dispute. ↩
- 19.
Richards, Martin, and Vincent Macaulay. “The Mitochondrial Gene Tree Comes of Age.” American Journal of Human Genetics 68(6):1315–1320. 2001. A review of the mitochondrial gene tree, the family tree of mitochondrial DNA lineages that the African-origin studies depended on. The article uses it to explain why the tree can fail to settle a root: some sites mutate fast and repeatedly, so many trees fit the data equally well.
- 19a.
“The high (average) mutation rate there, in conjunction with considerable variation in rate between sites, means that some sites mutate very fast indeed and that many have mutated many times in the genealogy. The result is that many tree topologies are equally plausible, and there may be no grounds — in parsimony analysis, at least — for deciding between them; hence, the genealogy can remain unresolvable.” The second passage sums up the 1991–92 exchange. “it was soon realized that there were millions of plausible alternative trees, many of which did not show the same pattern of an African root.” ↩
- 19a.
- 20.
Jeanson, Nathaniel T. “A Young-Earth Creation Human Mitochondrial DNA 'Clock': Whole Mitochondrial Genome Mutation Rate Confirms D-Loop Results.” Answers Research Journal 8:375–378. 2015. A young-earth creationist article that builds a whole-genome mutation rate by pooling three whole-genome parent-child studies into one count of transmissions and mutations. Its Supplemental Table 1, with formulas intact, reproduces every figure in Table 1 exactly when recomputed from its own inputs, so there is no arithmetic error in it. The article uses it as the whole-genome step of Jeanson's clock argument. Mirror: Assets.answersresearchjournal.org ↩ ↩
- 20a.
Table 1: Table 1 pools Guo et al. 2013 (26 pedigrees, 0 mutations), Rebolledo-Jaramillo et al. 2014 (39 pedigrees, 0), and Ding et al. 2015 (333 pedigrees, 63): 63 / 6,594,462 bp-generations = 9.55 × 10⁻⁶ per base pair per generation, or 1.58 × 10⁻¹ per genome per generation, 95% CI 0.119-0.197. On the Rebolledo-Jaramillo row he writes: “it is unclear whether homoplasmic mutations were even scored in the 39 mother-child pedigrees that were examined. Since none were reported, I assumed that none occurred.” Scoring a study zero because it did not report the quantity is not the same as the study reporting zero. ↩ ↩
- 20b.
“The only remaining caveat to the present results is whether the mutation rate reported in Ding et al. (2015) represents a germline rate rather than a somatic mutation rate. To confirm germline transmission in the future, the DNA sequences from at least three successive generations must be sequenced to demonstrate that variants were not artifacts of mutation accumulation in non-gonadal cells.” That test has since been run, see Connell et al. 2022, and it went against him. ↩ ↩
- 20c.
Section Discussion: “DNA sequences from fossils are too degraded to be useful for comparative DNA analyses today”. The sentence continues by citing Criswell 2009, Jeanson 2015 and Thomas and Tomkins 2014 for this "previous contention". ↩
- 20a.
- 21.
Kim, Hie Lim, and Stephan C. Schuster. “Poor Man's 1000 Genome Project: Recent Human Population Expansion Confounds the Detection of Disease Alleles in 7,098 Complete Mitochondrial Genomes.” Frontiers in Genetics 4. 2013. A survey of 7,098 complete human mitochondrial genomes that reports how much people's mitochondrial DNA differs on average. The mean pairwise difference across the whole molecule is 39.8 worldwide, with a maximum of 123; within Africa it is 64.0 (maximum 123), among non-Africans 35.4 (maximum 71), in Asians 30.1 and in Europeans 30.6. The control region differs by 9.9 over 1,122 bp and the rest of the molecule by 29.9 over 15,447 bp, a 4.6-fold difference in per-site diversity that the young-earth clock, whose D-loop and whole-genome rates differ by only 1.13-fold, does not reconcile. The paper is number 13 in volume 4. Jeanson's stated non-African targets of 39.8 and 39.3 are in fact the global figures. The article uses it as the observed comparator for every clock calculation in the article. ↩ ↩ ↩ ↩
- 22.
Behar, Doron M. et al. “A 'Copernican' Reassessment of the Human Mitochondrial DNA Tree from its Root.” American Journal of Human Genetics 90(4):675–684. 2012. The root lies between L0 and L1'2'3'4'5'6, the paper says they are. “separated from each other by 14 coding and four control-region mutations.” A reassessment of the human mitochondrial DNA family tree that proposes a new reference sequence rooted on Neanderthal mitogenomes, the Reconstructed Sapiens Reference Sequence. The abstract says the phylogeny was refined by adding information from 8,216 modern mitogenomes, while the mean distance below is reported over a larger set of 18,843, so the two numbers refer to different things. The mean distance from the reconstructed root to a modern tip is 57.1 substitutions (standard deviation 5.9, range 41-77), and the paper also reports statistically significant molecular-clock violations in M and L2, which is a reason for caution about every published interval on either side. The article uses it for the 57.1-substitution mean depth of the tree, its 41-77 range, and the bifurcation at the root. ↩ ↩ ↩ ↩ ↩ ↩ ↩ ↩
- 23.
Arithmetic for this article, reproduced by research/recheck.ts (output research/recheck-results.json) and research/clock-table.ts. A 6,000-year history at 25-year generations is 240 generations, so Behar's mean root-to-tip depth of 57.1 22 needs 57.1 / 240 = 0.238 lasting changes per genome per generation, and a 10,000-year history 0.143. Jeanson's 0.158 per generation gives 0.158 × 240 = 37.9 changes on one branch and 75.8 between two people. Connell's two homoplasmic changes in 345 transmissions are 0.00580 per transmission, and the published yearly rate of 1.30 × 10-8 times 16,569 sites times 25 years is 0.00538; the rate interval of 0.003 to 0.047 per site per million years gives 57.1 / (rate × 16,569) = about 73,000 years to 1.15 million. The required yearly rate is 57.1 / (16,569 × 6,000) = 5.74 × 10⁻⁷ per site, about 21, 27 and 34 times Fu's 2.67, Rieux's 2.14 and Soares' 1.665 × 10⁻⁸. At a representative rate of lasting change of 0.009 per generation, 240 generations give 2.16 changes per branch, leaving 54.9 of 57.1 (96%) to inherited variation; producing all 57.1 in 500 years needs 2.86 per generation (317 times 0.009) and in 1,500 years 0.95 (106 times). The sorting table follows one maternal line from two equally common starting sequences, sampling a fixed number of units each generation, with no new mutation and no selection; its exact probabilities are computed by the same script. Wei's 477 heteroplasmies at a mean frequency of 6.2% give 477 × 0.062 / 1,526 = 0.0194 expected eventual fixations per transmission under a neutral model. ↩ ↩ ↩ ↩ ↩ ↩ ↩ ↩ ↩ ↩
- 24.
Ding, Jun et al. “Assessing Mitochondrial DNA Variation and Copy Number in Lymphocytes of ~2,000 Sardinians Using Tailored Sequencing Analysis Tools.” PLoS Genetics 11(7):e1005306. 2015. A study that sequenced lymphocytes (white blood cells) from about 2,000 Sardinians at roughly 180-fold coverage and reported how often mothers and children share mitochondrial variants, which is concordance, not a mutation rate. It is the study Jeanson's whole-genome rate rests on, and the article uses it to show that his rate repurposes a concordance figure as a mutation count. ↩ ↩
- 24a.
Mitochondrial genome copy number per lymphocyte: mean 111.5, standard deviation 25.0, range 50-350. Estimates for other tissues run into the thousands. ↩
- 24b.
“Children and their mothers share essentially all homoplasmies. We observed 7,273 homoplasmic sites in 333 children, among which 7,238 (99.5%) were also observed in their mothers (Table 1).” Their Table 1 also gives 7,266 homoplasmic variants in the mothers. The young-earth rate is built by treating the 0.5% discordance (35 gains plus 28 losses) as 63 mutations. Under Jeanson's own rate the expected number of losses among 7,266 maternal variants in one generation is 7,266 × 9.55 × 10-6 = 0.069. He counts 28, which is 403 times more than his own model permits. ↩
- 24a.
- 25.
Jeanson, Nathaniel T. “On the Origin of Human Mitochondrial DNA Differences, New Generation Time Data Both Suggest a Unified Young-Earth Creation Model and Challenge the Evolutionary Out-of-Africa Model.” Answers Research Journal 9:123–130. 2016. Jeanson's own account of how the headline figure was drawn: “since only eight nucleotides separated the maximum reported mtDNA difference today from the maximum predicted post-Flood mutations (115), I simply reported the maximum YEC predictions as 123.” Figure 2: The prediction bar in Figure 2 is set equal to the observed value by hand. A creationist journal article by Nathaniel Jeanson of Answers in Genesis, arguing that Africans had a historically faster generation time, which would explain why African groups carry more mtDNA differences. It tests this with United Nations marriage-age tables and 369 mtDNA sequences, and it reports the maximum predicted difference as 123. The article uses it for Jeanson's claim that the three major nodes of mtDNA trees match the three wives of Noah's sons after the Flood, and for his statement that male generation times do not matter to mtDNA. ↩
- 25a.
“Going back to the time of the Flood, modern ethnic groups would have all traced their maternal ancestry back to the three wives of Noah's sons (Jeanson 2015a). Consistent with this historical record, three major nodes were visible in human mtDNA trees (Fig. 1).” The figure is an unrooted radial neighbour-joining tree of 369 sequences with no outgroup and no bootstrap support, and the nodes were identified by visual inspection. ↩
- 25b.
Jeanson's own footnote 3, which he wrote to justify using female marriage ages in his own generation-time calculation. “Again, note that male generation times are virtually irrelevant since mtDNA lineages stop with the men who inherit them. The only generation times historically relevant to mtDNA analyses are from females.” It disposes of patriarchal drive as a mitochondrial mechanism just as cleanly. ↩ ↩
- 25a.
- 26.
Howell, Neil et al. “The pedigree rate of sequence divergence in the human mitochondrial genome: there is a difference between phylogenetic and pedigree rates.” American Journal of Human Genetics 72(3):659–670. 2003. It counts arising, not fixing, in the paper's own words: “All newly arising substitutions, both heteroplasmic and homoplasmic, were included in our divergence-rate estimates.” A pooled analysis of nine control-region pedigree studies, counting 28 mutations in 2,633 transmissions and counting every newly arising change, whether it sat in some of a person's mitochondrial copies or in all of them. Its figure of 0.95 mutations per base pair per million years is a divergence rate, twice the mutation rate, which is verifiable from the paper's own table; halving it and keeping it inside the 1,122 base pairs of the control region gives the 4.72 × 10⁻⁷ tabulated in the article. It is the canonical pooled control-region figure, and the article relies on it. Multiplying the published figure by 16,569 sites and doubling it, as Carter 2025 endnote 10 does, inflates the answer roughly thirty-fold. ↩ ↩
- 26a.
The comparison, in Howell's words: “A control-region divergence rate of 0.95 mutations/bp/Myr is ∼10 times higher than the phylogenetically derived divergence rates for this region of the human mitochondrial genome. For example, estimates of 0.118 mutations/bp/Myr (Stoneking et al. 1992), 0.087 mutations/bp/Myr (Tamura and Nei 1993), and 0.098 mutations/bp/Myr (Hasegawa et al. 1993) have been obtained, with 95% CIs of 0.056–0.18, 0.025–0.15, and 0–0.22, respectively.” The abstract's verdict: “There is no evidence that any one factor explains this discrepancy, and the possible roles of mutational hotspots (rate heterogeneity), selection, and random genetic drift and the limitations of phylogenetic approaches to deal with high levels of homoplasy are discussed.” Howell's rate is expressed per base pair of a 1,122 bp control region even for the studies that sequenced only the hypervariable segments. He explains the choice: “we make the conservative assumption that there are 1,122 bp in the noncoding control region, even in those studies that limit their sequencing analysis to HVR1 and/or HVR2”. That is why the rate must be applied to whole-control-region divergence and not to a hypervariable-region-only distance. He lists three reasons his figure is conservative (hypervariable-region-only sequencing, heteroplasmy below about 20% undetected, and counting transmission events rather than sequenced individuals) and one that cuts the other way: “There will be a countervailing inflation of the pedigree rate if a large proportion of the mutations are somatic rather than germline.” That last correction was later measured at 39% by Rebolledo-Jaramillo33 and 45% by Santos et al. 2005. The words MRCA, Eve and 6,500 do not occur anywhere in the paper. Howell reports the rate gap and declines to date anything with it. ↩
- 26a.
- 27.
Pairwise distances across the control region of 54 modern human genomes. Original to this article: a comparison of 54 modern human control regions, pair by pair, counting the substitutions between each pair of mitochondrial genomes. The article uses it to turn the average distance between two humans into an age, by dividing that distance by a divergence rate. The pairwise distances were computed on the alignment described under the relative-rate test, restricted to the control region and projected onto revised Cambridge Reference Sequence coordinates. Positions inserted relative to the reference are dropped, and the alignment excludes deleted positions from each pair, so comparable sites per pair therefore range from 1,093 to 1,099 (mean 1,097.4). Across the 1,431 pairs among 54 modern genomes the mean is 15.88 substitutions (SD 6.20, range 0–33), giving 1.4470% mean pairwise divergence and 3.0082% for the most distant pair. Ages are distance ÷ divergence rate, since a divergence rate already counts both lineages. Two cautions. The 54-genome panel under-samples the deepest African branches, so the deepest-split column is a lower bound on age. The mean-pairwise column is the mean coalescent time, which is younger than the age of the common ancestor, so the two columns bracket the answer rather than competing for it. ↩
- 28.
Humphreys, D. Russell. “Evidence for a Young World.” Impact (Institute for Creation Research) (384). Jun 2005. Section Item 8: Item 8 states that measurements. “recently forced researchers to revise the age of 'mitochondrial Eve' from a theorized 200,000 years down to possibly as low as 6,000 years”. citing Gibbons 1998. No researcher revised anything, and Gibbons says the opposite in the next sentence. This is not a truncation but a claim the cited source does not contain. A short young-earth tract, first published by the Institute for Creation Research and reprinted by Answers in Genesis, listing fourteen phenomena its author argues set maximum ages far below the evolutionary ones. The article uses it because Item 8 says that research revised the age of mitochondrial Eve, and no researcher revised anything; Gibbons says the opposite in the next sentence. ↩
- 29.
Bechard, Paul. “Mutation Rates as a Creationist Clock.” University of South Dakota, UHON 390. 2005. Those citations are p. 28 for the line. “6,000 to 12,000 years”. and p. 29 for the line. “No one thinks that's the case.” A student page on a university course site that caught the Humphreys error in 2005. The article uses it as proof that the error was caught twenty-one years ago, and because it gives the only page-level citations within the Gibbons article that could be located. ↩
- 30.
MacAndrew, Alec. “Misconceptions Around Mitochondrial Eve.” evolutionpages.com. n.d. A web article correcting misconceptions about mitochondrial Eve, and the standard online rebuttal of them. It states four separate times that Parsons et al. and Howell et al. used RFLP analysis, and builds a conclusion on it. The article uses it as an example of an error on the other side, because Parsons sequenced 610 base pairs directly, as Gibbons states explicitly in the article MacAndrew rebuts. ↩
- 31.
Endicott, Phillip, and Simon Y. W. Ho. “A Bayesian evaluation of human mitochondrial substitution rates.” American Journal of Human Genetics 82(4):895–902. 2008. A Bayesian phylogenetic analysis of 177 human and two chimpanzee mitochondrial genomes that dated the human mitochondrial ancestor twice on the same data, once with a human-chimpanzee calibration and once with dates of human settlement inside the tree. The swap moved the answer by half, which is why the article treats every ape-calibrated date as conditional on its calibration. ↩ ↩
- 31a.
Section Results: “The estimated TMRCA of all human mitochondria from the internally calibrated analysis of the concatenated data set was 108 thousand years (kyr) (95% highest posterior density [HPD]: 82–134 kyr); in contrast, the externally calibrated estimate was 162 kyr (95% HPD: 122–213 kyr).” ↩
- 31a.
- 32.
Rieux, Adrien et al. “Improved calibration of the human mitochondrial clock using ancient genomes.” Molecular Biology and Evolution 31(10):2780–2792. 2014. A recalibration of the human mitochondrial clock using 30 high-quality ancient whole mitochondrial genomes and 320 contemporary ones, of which 26 ancient genomes were kept after damage screening. It gives a whole-genome rate of 2.143 × 10⁻⁸ per site per year and a mitochondrial time to the most recent common ancestor of 143,000 years (112,000-180,000). One error to note: Table S3 lists the six Blätterhöhle samples' ages in calibrated BC while labelling the column "Age (CalBP)," so each is exactly 2,000 years too young. The article uses it for the tip-calibrated clock and its tests of rate constancy, damage and calibration. ↩
- 32a.
Appendix S13, read as a test of rate constancy rather than of calibration. Thirteen radiocarbon-dated ancient genomes, each used alone as the sole calibration point, give thirteen rate estimates with mean 2.391 × 10⁻⁸ per site per year, standard deviation 0.077, coefficient of variation 3.2%, and a high-to-low ratio of 1.11 across samples spanning 5,228 to 39,464 years, a 15.6-fold range of age. Rieux's own summary: “The 95% HPD interval obtained for each independent ancient sequence systematically overlapped with all other HPDs, as well as with the mean estimate generated considering all tips simultaneously, suggesting that no single ancient sample is driving the overall substitution rate estimate.” This is the tightest test of between-lineage rate constancy in the human mitochondrial literature. ↩
- 32b.
The tip-calibrated clock returns a human-chimpanzee mitochondrial split of 4.14 Ma (2.99-5.45), meaning 4.14 million years ago, which is younger than the 6-7 Ma the fossil evidence is usually taken to support. The two calibration systems disagree with each other, which is the clearest evidence that tip calibration is not being quietly tuned to reproduce the assumed answer. ↩
- 32c.
Appendix S13, Table S13: each ancient sample used alone as the single calibration point. Twenty-one estimates across samples from 2,535 to 39,464 years old, a 15.6-fold range of age, give rates from 2.268 to 2.517 × 10⁻⁸, mean 2.391, standard deviation 0.077, coefficient of variation 3.2%. Their own summary: “The 95% HPD interval obtained for each independent ancient sequence systematically overlapped with all other HPDs, as well as with the mean estimate generated considering all tips simultaneously, suggesting that no single ancient sample is driving the overall substitution rate estimate.” Internal-node calibration behaves far worse: “the variance observed among individual substitution rate estimates was 11 times larger for internal nodes than tips.” The published regression of root-to-tip distance against sample age (Figure S10) gives R² = 0.7524, P < 2.2 × 10⁻¹⁶, though its branch lengths come from a clock-calibrated tree and so are not fully independent of the dates. ↩
- 32d.
The effect of accounting for PMD (post-mortem damage), in the authors' words: “Accounting for PMD had a limited influence on the rate estimation. We obtained a value of 2.23 × 10⁻⁸ μ/site/year (95% HPD: 1.71-2.75 × 10⁻⁸) for the whole molecule, which is 1.04× (4.2%) higher than when not accounting for PMD.” The estimated damage rate was 1.03 × 10⁻⁹ errors per site per year, which for the oldest sample amounts to an expectation of 0.67 deaminated sites. Damage biases the rate slower and Eve older. ↩
- 32e.
Appendix S6: among the 30 ancient sequences, 156 A/T and 36 G/C singleton SNPs were observed against 84.8 and 107.2 expected under no deamination; four Swedish sequences carried the excess and were dropped from the analysis. Four of thirty ancient genomes failed a damage screen, so the screening is real and it removes data. ↩
- 32a.
- 33.
Rebolledo-Jaramillo, Boris et al. “Maternal age effect and severe germ-line bottleneck in the inheritance of human mitochondrial DNA.” PNAS 111(43):15474–15479. 2014. A study of 39 mother-child pairs, using blood and buccal (cheek) tissue sequenced at 20,000-fold coverage with a 1% detection threshold, that asks whether a mother's age changes the mitochondrial DNA she passes on. It estimated the germline bottleneck at 30-35 mitochondrial genomes. The article uses it for the bottleneck formula that separates mutations that arise from mutations that become fixed, and for its maternal-age numbers. ↩ ↩ ↩ ↩
- 33a.
The correction stated as an equation: a new mutation is present in one of N bottleneck units, so. “only 1/N of them will go to fixation, leading to μ = α/N.” Their measured arising rate α is 0.143 mutations per genome per generation; their fixing rate μ is 0.0045. Jeanson's published young-earth rate of 0.158 is numerically almost identical to α, and is used as though it were μ. That substitution is the whole argument. ↩
- 33b.
The first quotation is from the Results: “For mothers we found a significant positive association (P = 0.039, 0.049, and 0.055 for combined, buccal, and blood heteroplasmies, respectively, Poisson regression)… Thus, older mothers accumulate more mutations in their somatic tissues, with the number of point heteroplasmies tripling over 30 y of life. Intriguingly, a positive association exists between the number of heteroplasmies in children and maternal age at fertilization (P = 0.010, 0.005, and 0.006).” The second: “mothers who conceived under the age of 20 transmitted zero to one heteroplasmies, this number was two to three for mothers conceiving in their late 30s.” The Discussion repeats the somatic figure: “the number of heteroplasmies in the maternal buccal and blood tissues triples over 30 y”. It sets this beside brain, where somatic mutation. “increases fivefold during 80 y of life.” The words nonlinear, exponential and quadratic do not occur in the paper, and no test of linear against curved is reported. The exponential shape of the fitted curve follows from the log link of Poisson regression, which is a modelling default. Anyone citing this paper as demonstrating a non-linear maternal age effect is over-reading it, in either direction. ↩ ↩
- 33c.
Figure 2: Its title is Maternal age effect, and it is the direct evidence for the distinction drawn here. The figure is at https://pmc.ncbi.nlm.nih.gov/articles/PMC4217420/figure/fig02/. The two series use different x-variables, and the figure draws a coloured range bar under the axis for each. Read off the plot, the red (fertilization) bar spans about 17 to 38 years and the blue (collection) bar about 25 to 58, with the oldest mother sampled at roughly 58 carrying three heteroplasmies. The blue fitted curve rises from about 1.0 to about 2.8 across that span, which is the tripling over 30 y of the text. The mothers' exact maximum age at collection is not printed anywhere in the text, so the numbers above are read from the plot rather than tabulated. “The dependence of the total number of heteroplasmies (blue) in mothers on their age at collection and (red) in children on maternal age at fertilization. Poisson generalized linear model fitted curves are indicated.” ↩
- 33a.
- 34.
Zaidi, Arslan A. et al. “Bottleneck and selection in the germline and maternal age influence transmission of mitochondrial DNA in human pedigrees.” PNAS 116(50):25172–25178. 2019. A genetic study of heteroplasmy, the mix of mutant and normal mitochondrial DNA inside one person, in 96 multigenerational families, with two tissues per person and a mean sequencing depth of about 11,400-fold. It estimated a germline bottleneck of 10.3 segregating units (95% HPD 8.5–12.3) and a germline rate of 4.72 × 10⁻⁷ per site per generation. The heteroplasmy count is a measurement; the bottleneck correction that turns it into a fixation rate is a model. The article uses it for the one measured lever on germline mutation, maternal age, and for the bottleneck that maternal age tightens. ↩ ↩ ↩ ↩
- 34a.
Two separate findings, both quoted directly. Section Discussion: “We found a significant positive association with maternal age for putative de novo germline mtDNA mutations. This parallels previous studies showing an increase in de novo germline nuclear mutations with paternal and maternal ages.” Section Significance statement: “Because of this bottleneck, which intensifies with increasing maternal age at childbirth, mutation frequencies can change dramatically between a mother and her child.” The second is the one that matters for the argument above and it is easy to miss: an older mother has a tighter bottleneck, so the two effects push the fixing rate the same way rather than cancelling. As with Rebolledo, no functional form is tested and the words nonlinear and exponential do not appear. ↩
- 34a.
- 35.
Kivisild, Toomas et al. “The role of selection in the evolution of human mitochondrial genomes.” Genetics 172(1):373–387. 2006. A 2006 study of complete coding-region sequences from 277 people on five continents, arranged as a family tree of mitochondrial lineages. Of the 1,788 mutations in the tree, 1,758 occurred at 1,292 variable coding-region sites, and the surplus of amino-acid-changing mutations is a general feature of the young branches, so the ratio of amino-acid-changing to silent variation declines with the age of the branch. It did not replicate the climate-based regional differences in amino-acid-changing mutations that Ruiz-Pesini et al. 2004 claimed, although Mishmar et al. 2003 is among the studies it cites for the claim that natural selection has significantly shaped mtDNA evolution. Its coalescent date for the tree is 160,000 years (SD 22,000). The article reads the observed decline as variants carried by healthy living people still being removed, and uses it for the claim that mitochondrial sites are not neutral. ↩ ↩ ↩
- 36.
Laricchia, Kristen M. et al. “Mitochondrial DNA variation across 56,434 individuals in gnomAD.” Genome Research 32(3):569–582. 2022. A survey of mitochondrial DNA in 56,434 people from the gnomAD genome database, counting which possible changes actually occur: about 55% of synonymous (silent) changes, about 10% of missense and RNA changes, and about 1% of stop-gain changes. The same data show 7,776 of 16,569 bases invariant (the same in everyone surveyed), 46.9%, not the 84.1% figure circulating in creationist literature, which is an artifact of an 827-sequence sample. The article uses it to show that protein-changing variants are still being removed from healthy living people. ↩ ↩
- 37.
Fan, Weiwei et al. “A mouse model of mitochondrial disease reveals germline selection against severe mtDNA mutations.” Science 319(5865):958–962. 2008. A mouse experiment that followed two mitochondrial mutations across generations, watching what happened during oogenesis (the formation of eggs). A severe ND6 mutation fell from 47%, to 14%, to 6%, then to 0% within four generations, while a mild COI mutation was retained. The article uses it to show that selection acts before any individual exists to be sampled. ↩
- 38.
Floros, Vasileios I. et al. “Segregation of mitochondrial DNA heteroplasmy through a developmental genetic bottleneck in human embryos.” Nature Cell Biology 20(2):144–151. 2018. A single-cell deep-sequencing study of human primordial germ cells, the early cells that go on to form eggs and sperm. It found a signature of selection against non-synonymous (protein-changing), tRNA and control-region variants inside the germline. The article uses it as evidence that selection acts in the germline, before anyone exists to be sampled. ↩
- 39.
Stewart, James B. et al. “Strong purifying selection in transmission of mammalian mitochondrial DNA.” PLoS Biology 6(1):e10. 2008. A study of how randomly generated mtDNA mutations pass from mother to offspring in the Trifunovic mutator mice. It is the direct experimental test of what happens to a raised mutation rate as it passes through the germline. The article uses it because the germline removes the protein-changing mutations that the polymerase adds. Mirror: PMC ↩ ↩
- 39a.
From the abstract: “We experimentally addressed this issue by studying the maternal transmission of random mtDNA mutations in mtDNA mutator mice expressing a proofreading-deficient mitochondrial DNA polymerase. We report a rapid and strong elimination of nonsynonymous changes in protein-coding genes; the hallmark of purifying selection. There are striking similarities between the mutational patterns in our experimental mouse system and human mtDNA polymorphisms.” The mechanism the young-earth argument needs is the mechanism this paper shows the germline undoing. ↩
- 39b.
Section Results, first paragraph: “We used eight mtDNA mutator founder females to establish independent maternal lines through 13 F1 females.” “We sequenced the entire mtDNA of 190 animals from generations N2 to N6 and identified 1,069 unique mutations (Dataset S1). The typical animal carried approximately 30 mtDNA mutations (mean = 29.8 mutations, standard deviation = 9.2). In each line, a large proportion of the identified mtDNA mutations (38.48%) were transmitted to the descendents of that particular N1 female, similar to the propagation of mtDNA haplogroups in human pedigrees.” The founders carried two copies of the proofreading-dead polymerase gene and their daughters one; from the next generation on only females with the normal gene were bred, so every mutation scored was made in the germlines of at most three mutator-carrying females. ↩ ↩
- 39a.
- 40.
Henn, Brenna M. et al. “Characterizing the Time Dependency of Human Mitochondrial DNA Mutation Rate Estimates.” Molecular Biology and Evolution 26(1):217–230. 2009. A study that calibrated the human mitochondrial clock on archaeological settlement dates, using within-human comparisons, to test whether the mutation rate depends on how far back it is measured. It found a rapid decay in the rate between about 2,500 and 50,000 years ago, and its within-human estimates are higher than human-chimpanzee estimates. The article uses it because it is the one study that set out to measure this decay in humans, and it cuts both ways. Mirror: Archive.org
- 40a.
Their Table 1 coding-region rates for five Sahul and Oceanic lineages, in substitutions per base per million years: New Britain M28 0.0265, Australian O 0.0317, Papua New Guinean P1 0.0327, Australian M42 0.0336, Oceanic P 0.0401, a 1.51-fold spread. Verbatim: “The coding region estimates from Papua New Guinean (P1) and Australian (M42, O) populations appear to experience a slight 'uptick' or small increase in rate relative to the preceding younger lineages. These three haplogroups average 0.033/bp/My”. “even the Oceanic-specific haplogroup P (n = 39, including P1) gives an elevated rate of 0.040/bp/My, assuming a colonization time of 45 thousand years ago for Sahul.” These rates are calibrated on archaeological arrival dates rather than measured directly, and the authors say which way that biases them: “Given that we always chose the oldest haplogroup in a sample set, we think it is more likely that we would overestimate the rate, rather than underestimate the rate.” ↩
- 40b.
Fourteen independent hypervariable-region-1 rates, each calibrated on a different archaeological settlement date, plus ten coding-region rates calibrated the same way. The abstract, verbatim: “Our new estimates establish a rapid decay in evolutionary mutation rate between approximately 2,500 and 50,000 years ago and a slow decay from 50,000 to 6 Ma.” The proposed cause is demographic rather than selection: “serial bottlenecks prior to the Holocene”. ↩
- 40c.
The magnitudes, verbatim from the Discussion: “based estimates decline by about 5-fold, whereas the coding region rates decline only about 2-fold in comparison to pedigree-based estimates.” Their fourteen hypervariable-region rates run from 1.10 × 10⁻⁷ per site per year (Japan, calibrated at 32,000 years) to 5.47 × 10⁻⁷ (the Marianas, calibrated at 4,300 years), decreasing monotonically with calibration age; their ten coding-region rates span only 1.33 to 2.68 × 10⁻⁸, which is where the radiocarbon-tip rates obtained years later by different means also land. These are hypervariable-segment rates and must not be rescaled across 16,569 sites. ↩ ↩
- 40d.
Page 222, section Results: “Genealogy-based rate estimates between 2,500 and 5,000 years ago are indistinguishable from pedigree-based mutation rate estimate (tables 1 and 2). This remains true across different haplogroups and populations from vastly different geographic locations, for example, Canary Islands versus Samoa.” Page 220, table 2: Divergence rates per base per million years, calibrated on archaeological first arrival: Canary Islands U6b1 0.81 (2,500 years), Samoa B4a1a1 0.74 (2,800), Nauru 1.03 (4,000), Palau 0.89 (4,200), Marianas 1.09 (4,300), Paleo-Eskimo A2 0.81 (5,000); mean 0.90. Page 223: “The Polynesian-specific B4a1a1 haplogroup was the youngest haplogroup in our data set and gave an estimate of 0.046/bp/My.” “There appears to be virtually no change in the coding region rate over the 10,000 year span between the Polynesian and American estimates.” Page 218: “All mutation rates discussed here will be in the form of divergence rates”. ↩ ↩
- 40a.
- 41.
Guo, Yan et al. “Very low-level heteroplasmy mtDNA variations are inherited in humans.” Journal of Genetics and Genomics 40(12):607–615. 2013. Their finding, in their words: “Homoplasmic SNPs were inherited without exception within each family.” A sequencing study of 26 mother-child pairs at a median depth of 3,981-fold, more than twenty times deeper than the Sardinian data the young-earth rate is built on. It found zero fixed changes in 26 transmissions, where Jeanson's rate predicts 4.1; the article uses it as a test of that rate. ↩ ↩ ↩
- 42.
Arbeithuber, Barbara et al. “Allele frequency selection and no age-related increase in human oocyte mitochondrial mutations.” Science Advances 11(32):eadw4954. Aug 6, 2025. The oocytes came from 28 eggs of eight women aged 20-29, 25 from six aged 30-34, and 27 from eight aged 35-42. The age result, from the abstract: “with age, mutations increased in blood and saliva but not in oocytes … mtDNA in human oocytes is protected against accumulation of mutations with aging and having functional consequences.” The mixed model gives Z-test P = 2.7 × 10⁻³ for blood, 5.7 × 10⁻² for saliva and 0.688 for oocytes; the permutation test on old versus young oocytes gives P = 0.550 and a 0.99-fold decrease. The paper's count is 52 de novo mutations at minor allele frequency >= 1% over. “70 mother-to-oocyte transmissions … the germline mutation rate to be 3.95 × 10⁻⁴ … and 1.95 × 10⁻⁵ … mutations per site per generation for the D-loop and coding region, respectively.” The per-genome figure quoted in this article is computed from those two published rates over the regions they cover: 3.95 × 10-4 × 1,122 = 0.443 for the D-loop, and 1.95 × 10-5 × 15,359 = 0.300 for what the paper calls the coding region (protein-coding 11,341 bp, rRNA 2,513 bp and tRNA 1,505 bp). The 88 bp of non-coding sequence outside the D-loop is reported separately and omitted here. Together they give 0.743 mutations per genome per generation over the 16,481 bp rated, or 4.5 × 10⁻⁵ per site per generation and 1.8 × 10⁻⁶ per site per year at 25 years. The implied Eve age divides Behar's 57.1 root-to-tip by that figure. A 2025 study that applied duplex sequencing, whose error rate is below 10-7, to 80 single human eggs (oocytes) from 22 women aged 20 to 42, with blood and saliva from the same donors. The article uses it as the only direct measurement of the quantity a young-earth rescue would need, and it points the wrong way for that rescue. Mirror: PMC ↩ ↩ ↩ ↩
- 42a.
The same laboratory's earlier results in other mammals, which is why the human null should be quoted with its limits rather than as a settled fact. Mouse: Arbeithuber et al., "Age-related accumulation of de novo mitochondrial mutations in mammalian oocytes and somatic tissues," PLoS Biology 18(7):e3000745 (2020), where "mtDNA mutation frequencies 2- to 3-fold higher in 10-month-old than in 1-month-old mice." Macaque: Arbeithuber et al., "Advanced age increases frequencies of de novo mitochondrial mutations in macaque oocytes and somatic tissues," PNAS 119(15):e2118740119 (2022), in which oocyte mutation frequency rises about 2.5-fold to age nine and does not rise afterward, against ~3.5-fold in liver and ~2.8-fold in muscle over twenty years. So two non-human primates and one rodent show an oocyte age effect of some size, and the human study does not. Twenty-two women is a small sample and the question should be regarded as open rather than closed, but it is now open with a direct measurement pointing one way, where before it was open with no direct measurement at all. ↩
- 42b.
Section Results: “we computed the germline mutation rate to be 3.95 × 10 −4 [95% confidence interval (CI): 2.68 × 10 −4 to 5.60 × 10 −4 ] and 1.95 × 10 −5 (95% CI: 1.21 × 10 −5 to 2.99 × 10 −5 ) mutations per site per generation for the D-loop and coding region, respectively.” ↩
- 42c.
Section Discussion, Germline mtDNA mutation rate estimates: “When including only mutations measured at MAFs ≥ 5%, our mutation rate estimate for the coding region is 2.50 × 10 −6 (95% CI: 5.16 × 10 −7 to 7.32 × 10 −6 ) mutations per position per generation—which is in the same range as the estimate produced by Árnadóttir and colleagues based on pedigrees and using the same MAF cutoff”. “This is about 5× higher than a previous estimate by Wei and colleagues based on a pedigree analysis using a similar MAF cutoff”. The second quotation is about the D-loop rate at the 1% cutoff. ↩
- 42d.
Section Discussion: “Considering all inheritable heteroplasmies, we estimated the effective germline bottleneck size to be ~909 segregating units (CI: 0.47 to 5329.73). Considering only heteroplasmic sites for which at least one sample had MAF ≥ 1%, we estimated a bottleneck size of ~30 segregating units (CI: 0.02 to 178.53).” Section Results: “Considering each age group separately, we estimated the effective bottleneck size to be 25.03 units (95% bootstrap CI: 0.47 to 98.42) for young women, 38.60 units (95% bootstrap CI: 0.02 to 74.42) for women in the intermediate age group, and 28.38 units (95% bootstrap CI: 0.38 to 178.53) for old women (table S15). Thus, the bottleneck size was not significantly different among women in different age groups.” ↩
- 42a.
- 43.
Jeanson, Nathaniel T. “Y-Chromosome-Guided Analysis of Mitochondrial DNA Lineages in the Americas: New Evidence for a Mitochondrial DNA Root, for a Mitochondrial DNA Clock, and for at Least One Migration from Asia into the Americas in the First Millennium BC.” Answers Research Journal 18:347–375. 2025. Jeanson's study of mitochondrial DNA lineages in the Americas. It replicates the Y-chromosome findings in mtDNA and argues for mtDNA as a molecular clock. The paper never names "Connell", "Norfolk", "Árnadóttir" or "deCODE". The article cites it as the mitochondrial confirmation Jeanson points to, and shows that it never addresses the studies that test his rate. ↩
- 43a.
“I used an overall timeframe of 4,441 and 4,026 years from the node that joins haplogroup L and mtDNA macrohaplogroup M, rather than the 4,636 and 4,206 years that I employed for the rest of the haplogroups in the tree.” From the paper's methods note on time frames. Both pairs of years are inputs to the calculation, not results of it. ↩
- 43b.
“In short, we don't yet know whether mtDNA acts like a simple biological clock. How could we find out whether mtDNA does?” The author's own framing, in the paper that the 2026 interview offers as its confirmation. ↩
- 43c.
Page 352: “In 2015, Jeanson equated the three major mtDNA haplogroups—M, N, and L—with the three wives of Noah’s sons (Jeanson 2015a). Effectively, this model puts three roots on the tree in the sense that each base for the M, N, and L branches represents the same point in time—the Flood. Neither of these root models is supported by as much evidence as supports the Y chromosome root position (Jeanson 2022).” The other root model is the 2008 consensus sequence of Carter, Criswell and Sanford (Jeanson spells the last name Stanford), which put the root at macrohaplogroup R. ↩
- 43a.
- 44.
Jeanson, Nathaniel T. “Does Modern Genetics Confirm the Bible? | Dr. Nathaniel Jeanson Explains.” YouTube, Standing For Truth. Mar 10, 2026. An interview on the Standing For Truth show, hosted by Donny Maddensky and Sam, with Jeanson, a Harvard-trained cell biologist and researcher with Answers in Genesis. The host puts the mutation-versus-substitution objection to him at 46:05–47:20 and he answers through 53:40. The video runs 1:00:25. The article uses it as Jeanson's most recent word on the objection, given in speech rather than in print.
- 44a.
At 47:59–48:51: “how fast or slow does mom mutate the DNA to daughter”. “about an average of one mistake every five to ten generations”. “I had been assuming that rate had been … consistent in the past. It's basically uniformitarianism”. Spoken words, punctuated by this article, quoted only where YouTube's captions and an independent local transcription agree. The omission at "had been … consistent" is a self-correction, "had been continued, had been consistent". ↩
- 44b.
At 49:58: “The biggest gift though from Dan has been arguing that I'm wrong on mutation versus substitution rate because the textbooks say otherwise.” At 50:27: “It's a fundamentalist atheistic religion or agnostic religion, whatever you want to call it.” At 51:27: “What we should be saying scientifically is how can we test whether or not the rate in the present has been continuous in the past.” At 53:18: “The predictions have been confirmed. Last summer with mitochondrial DNA finally confirmed over multiple generations the predictions that I laid out.” ↩
- 44c.
At 53:37: “So, I'm conflating substitution rate and mitochondrial [sic]. No, I'm equating substitution rate and mutation rate because the data says so.” ↩
- 44a.
- 45.
Creation Myths. “Bad Creationist Genetics: 'I'm treating the mutation rate as a substitution rate' – Dr. Jeanson.” YouTube. Jun 3, 2022. A 4:30 clip posted on the Creation Myths channel by Dan Stern Cardinale, cut from a call-in conversation with Jeanson on the Apologetics Live show on 2 June 2022. The clip is the critic's selection. The article quotes it as Jeanson's own statement of the rate policy that the critic says his work depends on.
- 45a.
At 1:17–1:30: “the mutation rate is three mutations per generation and I'm treating the mutation rate as a substitution rate, that this rate is consistent. … That's what I'm doing.” Jeanson speaking; the omission is a "Thank you" in the exchange. The "three mutations per generation" is not the mitochondrial figure, so the sentence is quoted only for the rate policy it states. Quoted where YouTube's captions and an independent local transcription agree. ↩
- 45a.
- 46.
Carter, Robert W. “Genealogical vs Phylogenetic Mutation Rates: Answering a Challenge.” Proceedings of the Ninth International Conference on Creationism, 168–180. 2023. A conference paper that tests whether natural selection, genetic drift or low mutation rates can explain away the gap between the genealogical mutation rate, measured in families, and the phylogenetic rate, calculated from fixed differences between species. Carter's abstract says that the population-modeling software Mendel's Accountant and simple statistics show that these explanations do not work. The article cites it as the fullest young-earth engagement with the pedigree-versus-phylogenetic question in print, and as the source of the population-genetics argument summarised above. ↩
- 46a.
Page 169: “Even though their estimate equated to only 0.029 mutations per generation, they claim this was 16 times higher than typical phylogenetic estimates.” Carter's own summary of Connell et al. 2022 in the same paragraph. The study covers 225 individuals and 345 generational events. Carter reports the Norfolk Island study accurately, including the transmission count, and flags the tension between the small absolute rate and the paper's headline ratio. He does not resolve it, and he does not cite the fixed-only figure. ↩
- 46a.
- 47.
Gupta, Rahul et al. “Mechanism of age-related accumulation of mtDNA mutations in human blood.” Nature 656:140–148. 2026. A genome study of mitochondrial DNA in the blood of 736,038 people, 620,385 of them after quality control. It found that low-level mitochondrial changes build up sharply in later life, look like copying errors rather than oxidative damage, and become visible as blood-cell clones carrying them expand. The article uses it to show that blood counts measure the growth of existing mutant cells, not a maternal clock. ↩
- 48.
Subramanian, Sankar et al. “High mitogenomic evolutionary rates and time dependency.” Trends in Genetics 25(11):482–486. 2009. In these genomes the rate at functionally constrained sites varies more than twofold with time, but. “the rate of evolution at synonymous sites remains the same.” If short-term clocks ran fast because the true elapsed time were short, silent (synonymous) sites would be inflated too. The inflation is confined to sites under selection, which is what selection predicts and what a compressed timescale does not. An article in the journal Trends in Genetics on ancient Adélie penguin mitochondrial genomes up to 44,000 years old, asking whether the rate of change depends on the time over which it is measured. The article uses it for the control that separates a timescale effect from a selection effect. ↩
- 49.
Subramanian, Sankar, and David M. Lambert. “Time Dependency of Molecular Evolutionary Rates? Yes and No.” Genome Biology and Evolution 3:1324–1328. 2011. A short comparison of human and primate mitochondrial genomes at five calibration depths, from 18,000 years within one haplogroup to the 6-million-year human-chimpanzee split, measuring silent and amino-acid-changing sites separately. Amino-acid-changing sites showed about 10.8-fold time dependence and silent sites about 1.2-fold, and the ratio of the two fell from 0.423 to 0.047 without any calendar date. It is the cleanest test in this article of whether the apparent slowdown comes from selection or from less elapsed time. ↩
- 50.
Millar, Craig D. et al. “Mutation and Evolutionary Rates in Adélie Penguins from the Antarctic.” PLoS Genetics 4(10):e1000209. 2008. The study sequenced that region in 508 families of Adélie penguins, comprising 915 chicks and both parents. All 62 germline heteroplasmies detected in mothers were also found in their offspring. The ancient-DNA rate came from 162 sub-fossil bones spanning a 37,000-year period. Counting every heteroplasmy as a mutation gave 54.9 mutations per site per Myr, with 95% confidence intervals of 41.2–68.6. Modelling heteroplasmy persistence gave μ = 0.55 against an ancient-DNA rate of k = 0.86, statistically indistinguishable (p = 0.13). The authors state that counting every heteroplasmy. “over-estimates μ by a factor of 5.” The apparent hundredfold inflation was an artifact of counting appearing variants as permanent ones, in a species where the answer is independently known. The best-controlled test of this question in any species, comparing a pedigree mutation rate with a radiocarbon-calibrated ancient-DNA substitution rate for the same 344 base pairs of the hypervariable region of the penguin mitochondrial genome. The article uses it because Adélie penguins are the only species with both a properly modelled pedigree mutation rate and a radiocarbon-calibrated ancient-DNA rate for the same DNA. Mirror: PMC ↩
- 51.
Lambert, David M. et al. “Rates of Evolution in Ancient DNA from Adélie Penguins.” Science 295(5563):2270–2273. 2002. The short-term rate came out. “approximately two to seven times higher than previous indirect phylogenetic estimates.” A study of ancient DNA from 96 radiocarbon-dated Adélie penguin bones, which measured how fast the sequence changed over the time the bones spanned. The article uses it as the ancient-DNA side of an apparent discrepancy, in a species whose history is independently known. ↩
- 52.
Shapiro, Beth et al. “Rise and Fall of the Beringian Steppe Bison.” Science 306(5701):1561–1565. 2004. The bison control-region rate, calibrated directly on 220 radiocarbon-dated fossils, gives 32% per Myr, agreeing with independently fossil-calibrated cattle rates of 30.1% and 38%. An independent clock check that came out right. The paper finds a large, diverse bison population living throughout Beringia until around 37,000 years before the present, when its genetic diversity began to decline dramatically. A study that used ancient DNA and Bayesian statistics to reconstruct the genetic history of steppe bison across Beringia, the region between eastern Siberia and northwestern Canada, through the late Pleistocene and Holocene. The article uses it as an independent clock check, since its bison rate was calibrated on dated fossils and agrees with cattle rates that were calibrated on fossils too. Mirror: Summit.sfu.ca ↩
- 53.
Bollongino, Ruth et al. “Modern taurine cattle descended from a small number of near-eastern founders.” Molecular Biology and Evolution 29(9):2101–2104. 2012. A study of mitochondrial sequences from 15 Neolithic to Iron Age Iranian cattle, combined with modern data and serial coalescent simulation, to estimate how many wild females were first domesticated. Its answer of about 80 shows that domestication sampled standing wild variation, so a domestication date cannot be set against the age of the cattle mitochondrial ancestor. ↩
- 54.
Molak, Martyna, and Simon Y. W. Ho. “Prolonged decay of molecular rate estimates for metazoan mitochondrial DNA.” PeerJ 3:e821. 2015. The meta-analysis finds a significant negative slope of rate against calibration age in every taxonomic group and for both coding and non-coding markers. The authors also added thirty novel estimates and re-estimates from ancient DNA of 16 species. The generality is the point: an inflation that appears in every species tested, and in nuclear DNA, bacteria and viruses, is a property of rate estimation rather than evidence that any particular species is young. A meta-analysis of 239 published mitochondrial rate estimates from a wide range of amniote and insect taxa, each set against the age of the calibration used to make it. The article uses it to show that the short-term-fast, long-term-slow pattern is not a quirk of one group, since it appears across animals. ↩
- 55.
Jeanson, Nathaniel T. “Recent, Functionally Diverse Origin for Mitochondrial Genes from ~2700 Metazoan Species.” Answers Research Journal 6:467–501. 2013. A young-earth creationist study that compared the mitochondrial diversity of worms, flies, water fleas and humans with mutation rates measured in laboratory lines and families, and argued that the diversity fits a few thousand years and not the evolutionary timescale. The article uses its invertebrate comparison because it rests on a better kind of rate than his human clock.
- 55a.
Page 495, table 6: “Unrealistic mutation rate requirements for the evolutionary timescale”. The table gives years elapsed until a single mutation occurs: Caenorhabditis 21,752 (evolution), 12 (creation), 6–11 (actual); Drosophila 34,247, 17, 9–202; Daphnia 23,259, 31, 48–62; Homo 36,364, 2,020, 1,244–2,915. ↩ ↩
- 55a.
- 56.
Konrad, Anke et al. “Mitochondrial Mutation Rate, Spectrum and Heteroplasmy in Caenorhabditis elegans Spontaneous Mutation Accumulation Lines of Differing Population Size.” Molecular Biology and Evolution 34(6):1319–1334. 2017. Section Results: “The N = 1 MA lines contained nine base substitutions in frequencies ranging from 3% to near fixation (table 1), yielding a spontaneous rate of base substitution, μbs, of 4.32 × 10⁻⁸ per nucleotide site per generation (95% CI: 0.87 to 9.44 × 10⁻⁸).” Section Discussion: “We note the existence of a greater than two-fold difference in the mtDNA μbs estimates from our analysis of C. elegans MA lines relative to that of Denver et al. (2000).” A laboratory study that propagated C. elegans mutation-accumulation lines at three population sizes for 409 generations and sequenced about 97% of their mitochondrial genomes. Its single-individual lines gave nine base substitutions, a rate about half the earlier estimate Jeanson's worm comparison used. ↩ ↩
- 57.
Jeanson's "actual" figure of 6 to 11 years per mutation for Caenorhabditis 55 corresponds to a laboratory rate of about 7 to 11 × 10-8 per site per generation, over a mitochondrial genome of about 14,100 bases averaged across C. elegans and C. briggsae, at generation times of 3.5 to 4 days, or 91 to 104 generations a year. Konrad's rate of 4.32 × 10⁻⁸ 56 gives 4.32 × 10-8 × 14,100 × 91 to 104 = 0.055 to 0.063 mutations per genome per year, or 16 to 18 years per mutation, against the 12 his young-earth model requires. The working is in research/young-age-evidence-2026-10-27.md. ↩
- 58.
Fu, Qiaomei et al. “Genome sequence of a 45,000-year-old modern human from western Siberia.” Nature 514(7523):445–449. 2014. A genome study of one femur from Ust'-Ishim in western Siberia, dated by two independent radiocarbon measurements of 41,400 ± 1,300 and 41,400 ± 1,400 BP, which calibrate to 46,880-43,210 cal BP. Its mitochondrial rate is 2.53 × 10⁻⁸ per site per year (95% HPD 1.76-3.23), and the abstract's rounded interval of 1.8 to 3.2 × 10⁻⁸ is not a point estimate; the paper's own supplement gives the rate of Fu 2013 as 2.47 × 10⁻⁸, where the published value is 2.67. The article uses it as the single dated tip of its rate table and as its answer to the claim that fossil DNA is too degraded to use. ↩ ↩
- 59.
Översti, Sanni, and Jukka U. Palo. “Variation in the substitution rates among the human mitochondrial haplogroup U sublineages.” Genome Biology and Evolution 14(7):evac097. 2022. A dating study of 234 ancient human mitochondrial genomes from haplogroup U, a branch of the maternal family tree, each dated by radiocarbon (calibrated years before present, cal BP). Of these, 212 are Holocene and 84 are younger than 4,500 cal BP. The authors ran twelve root-to-tip regressions (tests of how many mutations build up with time) on non-clock trees run in TempEst, all with positive slopes and R² from 0.10 to 0.84. Their haplogroup U4 regression on 42 Holocene-only samples gives 8.80 × 10⁻⁸ per site per year, the fastest defensible figure in the literature and the best number available to the young-earth side; even it implies a U4 coalescence beyond 12,000 years, for one small twig of the tree. The article uses it for the largest lineage-to-lineage rate difference in human mitochondrial DNA, about twofold between U2/U5a and U5b. ↩ ↩ ↩ ↩
- 59a.
On lineage-to-lineage rate variation, the authors write: “The largest differences are seen in scenario B, where the rates for U2 and U5a are 2.1 and 1.9 times higher than for U5b, respectively (fig. 3 and supplementary table S5, Supplementary Material online). However, it has to be noted that the 95% highest posterior density (HPD) intervals are largely overlapping suggesting non-significant differences between values.” This is the largest documented rate difference between two lineages of human mitochondrial DNA, and its own authors decline to call it significant. It is the correct measured ceiling against which any claim of Neanderthal-specific acceleration has to be judged. ↩
- 59a.
- 60.
Refit of 229 radiocarbon-dated haplogroup U genomes with a separate rate for each subclade. Original to this article: the 229 radiocarbon-dated haplogroup U genomes, described under the branch-shortening regression, were refitted twice, once with one slope shared across the four subclades and a separate intercept for each, and once allowing every subclade its own slope as well, comparing the two by F-test. The article uses it to reject exact rate homogeneity across the subclades, so that human lineage rates are quoted as varying by up to about threefold rather than by at most twofold. The four fitted rates are U2 3.27 × 10⁻⁸, U5a 2.12 × 10⁻⁸, U5b 1.03 × 10⁻⁸ and U4 5.24 × 10⁻⁹ substitutions per site per year. The extreme ratio is 6.3-fold, and the U2-to-U5b ratio, the comparison Översti and Palo report, is 3.2-fold against their published 2.1-fold. Separate slopes for each subclade give F(3,220) = 5.64, p = 0.0010, rejecting a single shared rate. The result is fragile, and the fragility is part of the finding. U2 is the only subclade with samples older than 26,000 years and it carries the whole effect: excluding U2 gives F(2,205) = 1.17, p = 0.31; restricting all four clades to samples younger than 10,000 years gives F(3,198) = 1.29, p = 0.28; U5a against U5b alone gives F(1,167) = 1.92, p = 0.17. The most likely reading is that a subclade whose samples span a wide age range yields a better-determined slope than one whose samples do not, rather than that these lineages truly differ threefold. What the article takes from it is only the negative point: exact rate homogeneity is rejected on its own data, so a flat statement that human lineage rates vary by at most twofold is not supportable, and the ceiling should be quoted as about threefold. ↩ ↩
- 61.
Root-to-tip regression of substitution count against radiocarbon age, on 229 ancient haplogroup U mitochondrial genomes. A regression of substitution count against radiocarbon age, run for this article from raw sequence rather than taken from the published paper, on 229 ancient haplogroup U genomes that passed quality control, aged 1,475 to 37,985 cal BP, of which 82 are younger than 4,500 cal BP. The sequences and dates come from Översti and Palo's compilation. The slope is 2.58 × 10⁻⁸ per site per year (95% CI 2.11-3.06 × 10⁻⁸), with t = 10.7 and R² = 0.56. One modelling choice is declared in the main text and repeated here because it matters: the four subclades of haplogroup U sit at different depths below the U node for reasons unrelated to sample age, so a naive pooled fit mixes between-clade depth into the age signal and biases the slope downward, giving 1.74 × 10⁻⁸ with R² = 0.14. Allowing each subclade its own intercept and fitting one common slope is the standard fix and gives the figure above. Both are reported, and both are far below the pedigree rate. The article uses it as its own measurement of the historical rate, to set against the pedigree figures. ↩ ↩
- 62.
Fu, Qiaomei et al. “A revised timescale for human evolution based on ancient mitochondrial genomes.” Current Biology 23(7):553–559. 2013. A dating study that used ten radiocarbon-dated ancient mitochondrial genomes, spanning 40,000 years, as tip calibrations (samples of known age that anchor the clock), with no ape calibration anywhere in it. It gives a whole-genome rate of 2.67 × 10⁻⁸ per site per year (95% HPD, the range the model gives the rate with 95% probability, 2.16-3.16) and a mitochondrial TMRCA, the time back to the most recent common ancestor, of 157,000 years (120,000-197,000); the same data analysed by linear regression give 1.92 × 10⁻⁸, a 39% difference, and the regression's own confidence interval spans a 2.3-fold range on nine points. The article uses it for its calibrated rate in the comparison table and for the Cro-Magnon 1 redating quoted below. ↩
- 62a.
On the Cro-Magnon 1 sample, archaeologically assumed to be about 30,000 years old but carrying the derived haplogroup T2b1, the authors wrote: “Since the radiocarbon date for this specimen was obtained from an associated shell, we AMS dated the sample itself. Surprisingly, the sample had a much younger age of about 700 years, suggesting a medieval origin. Consequently, this bone fragment has now been removed from the Cro-Magnon collection at the Musée de l'Homme in Paris.” The genetics predicted a redating and the redating confirmed it. ↩
- 62a.
- 63.
van Oven, Mannis, and Manfred Kayser. “Updated comprehensive phylogenetic tree of global human mitochondrial DNA variation.” Human Mutation 30(2):E386–E394. 2009. The standard reference tree of human mitochondrial DNA family lines, here its Build 17 release of 18 February 2016, built from 24,275 complete sequences. The root node has exactly two children, L0 and L1'2'3'4'5'6, with 10 mutations on the L0 stem and 8 on the other. Nearly every deep node is a bifurcation, and the one genuine polytomy is L3, which has seven children including M and N; L3 sits 35 mutations below the root, inside the African clade. The article uses it to show that the two deepest branches are the only two at the root. ↩ ↩
- 64.
Thomas, Brian. “DNA Trends Confirm Noah's Family.” Acts & Facts. Institute for Creation Research. Jun 30, 2016. The editor's note appended after readers objected: “Some readers have contacted us about what they perceive to be a fourth node in the lower right of the figure from Dr. Jeanson's paper. This area should not be considered a node because the distance between it and the nearest central node is almost twice as far as that between the three central nodes.” The same article converts Jeanson's stated range of. “about 2-8 nucleotides”. into. “eight”. , and his stated range of. “121-137 mutations”. into a point prediction of 123, and reports the match to the observed 123 as. “a spectacular confirmation”. and. “Check, check, and check.” A magazine article from the Institute for Creation Research that reports Jeanson's mitochondrial DNA results as a confirmation of Noah's family. Jeanson's own text is more careful than the popularisation of it. The article uses it to show that the claim had to be defended by judging visual clusters by eye after readers objected. ↩
- 65.
The distances are computed for this article from one alignment of 54 living humans (the revised Cambridge Reference Sequence plus Ingman's 53), 36 Neanderthal records, 7 Denisovan records, the Sima de los Huesos specimen and 166 chimpanzees, projected onto reference coordinates with the length-polymorphic tracts excluded; the pairwise matrices are in
research/data/archaic-pairwise.npzand the sequence list inresearch/data/archaic-sequence-inventory.tsv. Means over all pairs between groups: human-human 59.40 (maximum 106), human-Neanderthal 199.35 (160 to 225), human-Denisovan 360.83 (338 to 391), human-Sima 279.33, Neanderthal-Neanderthal 31.49, Denisovan-Denisovan 42.76. Against the reference sequence, the 36 Neanderthals sit 169 to 209 (mean 198.3; Goyet Q57-1, the lowest, has 98.1% of sites covered) and Denisova 3 sits 378 (382 before masking). Counting transversions only, the means are 4.12 human-human, 11.81 human-Neanderthal and 20.66 human-Denisovan. Among the 166 chimpanzees the mean pairwise distance is 214.14 with a maximum of 402, and 45.7% of pairs exceed 206. These are the panel's means, not a census of every sequence published. ↩ ↩ ↩ ↩ ↩ - 66.
Jeanson, Nathaniel T. “Response to 'On the Creationist View on mtDNA'.” Answers Research Journal 10:183–186. 2017. Jeanson's reply to a critic, Frello, whose internal-diversity test concerns the Neanderthal sequences. It argues that, when mutation rates are assumed constant, neither the evolutionary nor the young-earth timescale fits the ancient DNA, and it concedes that the young-earth rate is too low. The article uses it for Jeanson's own admission that current mutation rates are too low, on his timescale, to explain the ancient DNA differences.
- 66a.
“Second, even if we assume that Neanderthal and Denisovan DNA sequences are reliable, they don't fit any scientific model (YEC or evolution)—when we assume that rates of mtDNA mutation have been constant. With respect to the evolutionary timescale, current rates of mutation are much too high to explain the origin of modern humans, let alone the origin of Neanderthals and Denisovans… With respect to the YEC timescale, current rates of mtDNA mutation are too low to explain the differences between ancient DNA samples and modern human mtDNA sequences.” ↩
- 66b.
Section Examining Frello's Criticisms: Jeanson's answer to Frello's internal-diversity test, from the same paper. “The problem with Frello's argument is that he implicitly assumes a particular genealogical relationship among the Neanderthal individuals—and does so without any scientific justification. If Neanderthals are genealogically-related descendants of post-Babel peoples (as Fig. 11C of Jeanson [2015a] implies), and if the particular Neanderthal sequences that are compared have a close genealogical relationship, then almost by definition the Neanderthal sequences will be closer to one another than any are to modern human sequences.” The reply is a coherent objection to Frello's implicit assumption, but it supplies no rate, no mechanism and no test, and it moves the required acceleration onto the stem below the Neanderthal common ancestor rather than removing it. ↩
- 66a.
- 67.
Symmetric mutation requirement per generation on the human and Neanderthal branches. Original to this article: a restatement of the mutation requirement with no archaic date at all, using root-to-tip distances from the relative-rate alignment. Across all 1,890 human-by-Neanderthal pairs the Neanderthal branch averages 93.6 substitutions from the common ancestor and the human branch 102.9, a mean of 98.3 per branch. The article uses it to show that a 6,000-year timeline needs 0.409 mutations per genome per generation on each branch, which it sets against the pedigree rates. Over 6,000 years at 25-year generations, which is 240 generations and the most generous placement available to a young-earth model, since any Flood or Babel split is later and shorter, that is 98.3 / 240 = 0.409 mutations per genome per generation required on each branch. At 4,500 years it is 0.546 and at 3,000 years 0.819. The comparison rates are the per-generation figures from the article's pedigree table, and the shortfall column is 0.409 divided by each. This replaces, rather than supplements, the 30-versus-170 decomposition used earlier in this section, because that decomposition assumes the human-Neanderthal node coincides with mitochondrial Eve, which the measured branch symmetry contradicts. The earlier figure is kept only where the article is reconstructing a young-earth author's own framing of the claim. The sampling-time scenarios use the same branch counts with the formula yearly-rate ratio = branch-count ratio × T / (T − d), for an assumed shared ancestor T years ago and a specimen that died d years ago; the requirements per generation are the mean branch counts, 102.884 on the human side and 93.635 on the Neanderthal side, divided by the generations each branch had. The consensus test's interval is a Wilson interval on its 89 against 88 changes, and the equal-yearly-rate test is an exact binomial with p = (T − d) / (2T − d). These are reproduced by research/code/sampling-time-scenarios.ts, which writes research/data/sampling-time-scenarios.md. ↩ ↩
- 68.
Criswell, Daniel. “Neandertal DNA and Modern Humans.” Creation Research Society Quarterly 45(4):246–254. 2009. A detailed young-earth case, by a Ph.D. at the Institute for Creation Research, that the gap between Neanderthal and modern mtDNA is post-mortem damage. Habermehl 2010 and Carter 2009 both defer to it, and it is worth reading for its candour about its own statistics. Its evidence base is nine hypervariable-region-1 sequences and two hypervariable-region-2 sequences published up to 2007, PCR-amplified, from before enzymatic damage removal was routine. The article uses it as the older young-earth position on the archaic gap. ↩
- 68a.
The test and his own verdict on it: “The alignment identifies 40 transition sites between the nine Neandertal HVRI sequences and the Eve1.0 HVRI. Of these 40 sites, 16 are Type 1 transitions and 24 are Type 2 transitions.” “A chi-square test for the difference between Type 1: Type 2 transitions in Neandertal: modern human, and modern human: modern human gave values of X2= 3.7, with a P value = <0.10 and much closer to 0.05… The P value given for the Neandertal: modern humans Type 1: Type 2 transitions, is barely outside of the 0.05 standard but cannot be dismissed as being insignificant.” His modern-human baseline, from over 4,300 sequences: “232 transitions were identified in the HVRI. Of these, 128 are Type 1 transitions and 104 are Type 2 transitions.” That baseline is 44.8% Type 2, and the article's own 54-genome panel independently gives 46.0% for the same window, so his control is sound. His archaic figure of 60% is 24 of 40, which sits 1.8 standard errors above that baseline with a one-sided binomial probability of 0.053. Thirty-six whole genomes give 46.0% in the same window. ↩
- 68b.
On the thymine trimer: “Neandertal AF142095 has a thymine trimer inserted into the middle of what is called the poly-cytosine tract (polyC 309). A thymine trimer has not been identified for any of the 4300 modern human sequences… and none of the 21 primates have this insertion.” His own alternative reading, in the next section, locates the problem: “this research, and that of others… show that a sequence length polymorphism designated at site 309 is the most variable in the entire human mitochondrial genome. This poly-cytosine tract has four different sequence length polymorphisms identified in humans… with anywhere from 7-10 cytosines.” Every distance in this article excludes rCRS 303-315 along with the two other known length-polymorphism tracts, so nothing in the 199-substitution figure depends on it either way. ↩
- 68a.
- 69.
Sanchez-Contreras, Monica et al. “A replication-linked mutational gradient drives somatic mutation accumulation and influences germline polymorphisms and genome composition in mitochondrial DNA.” Nucleic Acids Research 49(19):11103–11118. 2021. A laboratory study that used Duplex Sequencing to map naturally occurring somatic mutations across mouse and human mitochondrial DNA. It shows that the normal mitochondrial mutation pattern looks like a damage pattern because it is one, produced in living cells rather than after death. The article uses it for that reason. Mirror: PMC
- 69a.
From the abstract: “We observe distinct mutational gradients in G→A and T→C transitions delimited by the light-strand origin and the mitochondrial Control Region (mCR). The gradient increases unequally across the mtDNA with age and is lost in the absence of DNA polymerase γ proofreading activity… Collectively, these patterns support genome replication via a deamination prone asymmetric strand-displacement mechanism as the fundamental driver of mutagenesis in mammalian DNA. Moreover, the distribution of mtDNA single nucleotide polymorphisms in humans and the distribution of bases in the mtDNA across vertebrate species mirror this gradient, indicating that replication-linked mutations are likely the primary source of inherited polymorphisms.” Two consequences for the arguments above. The inherited spectrum is a deamination spectrum, so a Type 1 : Type 2 ratio cannot distinguish inherited change from post-mortem change. And the gradient. “is lost in the absence of DNA polymerase γ proofreading activity”. This makes the polymerase-defect hypothesis of the previous section testable in principle by position rather than by rate: a Neanderthal population running a proofreading-deficient polymerase should show a flattened gradient, not merely a longer branch. That test was attempted here and cannot be run on existing data. The Neanderthal stem carries about 180 substitutions, of which 32 fall in the gradient classes at the informative ends of the major arc; separating "gradient present" from "gradient absent" needs on the order of two thousand. The shortfall is roughly sixty-five-fold and is not fixable by better statistics. It is recorded here rather than dropped, because it is a real prediction of a young-earth mechanism that more archaic genomes could one day decide. ↩
- 69a.
- 70.
van der Valk, Tom et al. “Million-year-old DNA sheds light on the genomic history of mammoths.” Nature 591(7849):265–269. 2021. Kjær's summary of the state of the art: “The oldest known DNA obtained to date has been recovered from a permafrost-preserved mammoth molar dated to 1.2-1.1 Myr using geological methods.” A study of the genomic history of mammoths from DNA more than a million years old. The same footnote also cites Kjær, Kurt H., et al., "A 2-million-year-old ecosystem in Greenland uncovered by environmental DNA," Nature 612(7939):283-291 (2022), doi:10.1038/s41586-022-05453-y. The article uses these against the claim that DNA cannot survive tens of thousands of years, a reasonable inference from 1996 kinetic calculations that is no longer one. ↩
- 71.
Cserháti, Matthew. “Ancient DNA Shows Neanderthals and Denisovans Descending from Noah in the Line of Ham.” Answers Research Journal 17:43–61. Jan 31, 2024. A creationist paper that rebuilds the Neanderthal and Denisovan Y-chromosome tree on a "Noah" root instead of a root shared with chimpanzees, and explains the long branches with high mutation rates. The journal's disclaimer says the views are those of the writer, not necessarily those of the editor or Answers in Genesis, and the paper says its conclusions remain tenuous because only a few Neanderthal Y chromosomes have been sequenced. The article uses it because it is the current Answers in Genesis position on archaic hominin DNA: re-root the archaic Y-chromosome tree on a "Noah root," and explain the residual divergence by hypermutation. ↩
- 71a.
On the Y chromosome: “If sequencing errors did not cause the excessive number of Neanderthal Y chromosome variant alleles, the only other option is hypermutation. So, what caused the high mutation rate found in Neanderthal Y chromosomes? One possibility is patriarchal drive, which causes increasing mutations in children born to fathers of advanced age (Carter 2019).” And, extending it to the mitochondria: “If the high mutation rate indicated by divergence of the Neanderthal Y chromosome is due to defective DNA repair, it should affect the entire Neanderthal genome. Perhaps the great divergence of the Neanderthal mitochondrial genome from moderns is also due to hypermutation.” The wording is "perhaps," with no rate attached. The first mechanism offered, patriarchal drive, is a paternal-age effect and cannot act on a maternally inherited molecule. ↩
- 71a.
- 72.
Green, Richard E. et al. “A complete Neandertal mitochondrial genome sequence determined by high-throughput sequencing.” Cell 134(3):416–426. Aug 8, 2008. A sequencing study of the Vindija 33.16 Neanderthal, which was sequenced at 34.9-fold average coverage and gives the 206-substitution difference from the human reference sequence. Modern-human contamination was measured at 0.5%, with an upper 95% limit of 0.87%. The article uses it because the authors measured the Neanderthal branch directly when they published the first complete Neanderthal mitochondrial genome, and they reported a raised dN/dS ratio on that branch. Mirror: PMC ↩ ↩
- 72a.
The branch-length result, in full, with the caveat the authors attach to it: “A tantalizing finding is that when all substitutions in the mtDNA are analyzed, the Neandertal mtDNA lineage is shorter than the human lineage by approximately 20% (Supp. Fig. 3B). It is tempting to speculate that this is due to the fact that the Neandertal mtDNA is ~38,000 years older than the extant human mtDNA sequences to which it is compared. However, under the assumption that the evolutionary dates are reasonably accurate, the reduction in length is about three times as large as would be expected if it was entirely due to the age of the fossil. It should be noted that for small evolutionary distances such as these, there is a large stochastic component to phylogenetic branch length.” Their own reading is that most of the 20% is stochastic, so this is not a precision estimate of a Neanderthal substitution rate. It remains the only direct measurement of the branch, and a lineage that must run at 5.7 times ours measures 0.8 times ours. ↩
- 72b.
The one Neanderthal-specific rate elevation that is real: “While lineage-specific estimates of dN/dS were sensitive to both the underlying model of sequence evolution and the number of outgroups considered (see Supp. Fig. 6 and Supp. Table 3), we consistently observed the highest dN/dS on the Neandertal lineage and this value was significantly higher than background rates in all comparisons (all P < 0.01; Supp. Table 3).” And the abstract: “There is evidence that purifying selection in the Neandertal mtDNA was reduced compared to other primate lineages suggesting that the effective population size of Neandertals was small.” Two limits on how much this can do for the young-earth case. First, dN/dS across the whole primate phylogeny is 0.051-0.087, so amino-acid-changing sites are a minority of substitutions; the fixed coding differences in the paper's own Table 2 total 74 silent against 26 replacement. Second, the raised ratio coexists with a total branch that is 20% short, which is what would be expected if selection is retaining slightly more of a small class while the underlying mutation rate is unchanged. ↩
- 72a.
- 73.
Tajima's relative-rate test of Neanderthal and modern human mitochondrial branches. Original to this article: an application of Tajima's (1993) one-degree-of-freedom relative-rate test, which needs no clock, no calibration and no split date. It counts, position by position, which of two lineages changed since they split from a common outgroup (a lineage that branched off earlier), and it finds a ratio of 1.01 between the Neanderthal and human branches. The article uses it as the clock-free test that the two lineages changed at the same rate. The test was run on 54 modern human mitochondrial genomes (the revised Cambridge Reference Sequence plus the Ingman 53), 35 Neanderthal individuals, 7 Denisovan and 8 chimpanzee genomes, all projected onto rCRS coordinates by the banded Needleman-Wunsch aligner used elsewhere in this article, with the three known length polymorphisms masked. The Neanderthal set is every near-complete GenBank record, minus the RefSeq duplicate, the partial record, and the Goyet Q56-1 genome deposited twice. For each position at which a modern human consensus, a Neanderthal consensus and an outgroup are all unambiguously called, the change is assigned to whichever lineage differs from the outgroup. Confidence intervals are Wilson intervals on the fraction of assigned changes falling on the Neanderthal branch, converted to a ratio. Two limitations. Thirty-five is not the whole corpus. Fotiadou et al. 2026 analyse 59 Neanderthal mitochondrial genomes, but GenBank's "Homo sapiens neanderthalensis"[Organism] query still returns only 38 near-complete records, the rest sitting in other archives or under other organism tags; the missing genomes would tighten the interval by roughly a third rather than move it. The Neanderthal specimens are 40,000 to 120,000 years old, so under a conventional timescale their branches should be shorter than ours by the mutations they did not live to accumulate, which makes a ratio of 1.01 slightly generous to the hypermutation case rather than harsh to it. ↩
- 74.
Meyer, Matthias et al. “A high-coverage genome sequence from an archaic Denisovan individual.” Science 338(6104):222–226. 2012. The paper's own caution should be carried with the number: "we caution that multiple sources of error may affect this estimate." The paper's comparison reads: “When comparing the number of substitutions inferred to have occurred between the human-chimpanzee ancestor and the Denisovan and present-day human genomes, the number for the Denisovan genome is 1.16% lower (1.13 to 1.27%) (Fig. 2) (8). This presumably reflects the age of the Denisovan bone, which had less time to accumulate changes than present-day humans.” A genome-sequencing paper that read a Denisovan genome at 30-fold coverage, meaning each position was read about 30 times, from a finger bone found in Denisova Cave in the Altai Mountains of southern Siberia. It compared the number of changes on the Denisovan and present-day human branches since their split from the human-chimpanzee ancestor, over roughly three billion base pairs, sharing no assumptions with any mitochondrial analysis. The article uses it as an independent nuclear-genome check that the archaic branch is shorter than ours, not longer. Mirror: Pgl.soe.ucsc.edu ↩ ↩
- 75.
Frello, Stefan. “On the Creationist View on mtDNA.” Answers Research Journal 10:181–182. 2017. A critique of the creationist mtDNA argument by a working Danish biologist, not a creationist, publishing inside the creationist journal, with Jeanson answering. His BLAST-derived figures, with GenBank accessions given in the paper, are maximum modern human to modern human about 120 nt; human to Neanderthal 180-240; maximum Neanderthal to Neanderthal about 80. His rejoinder, Answers Research Journal 10:237-238, abandons the technical argument and tells Jeanson to publish in mainstream journals instead, and Jeanson's fourth-round reply treats that as a concession and adds nothing technical. The exchange ends unadjudicated rather than settled, because the internal-diversity numbers are never revisited. The article uses it for its claim that observed Neanderthal diversity is 9% of what the hypothesis predicts. ↩
- 76.
Jeanson, Nathaniel T. “Response to Reply to Response to On the Creationist View on mtDNA.” Answers Research Journal 10. 2017. The fourth and last round of Jeanson's exchange with Stefan Frello, in which Jeanson treats Frello's withdrawal from the technical argument as a concession and spends the rest of the piece on peer review and scientific expertise. It contains no new technical material on Neanderthal mitochondrial rates and never returns to the internal-diversity numbers, so the technical question ends unsettled.
- 76a.
“Since Frello has refused to respond to the errors that I documented, I conclude that he has conceded the points that I raised”. ↩
- 76a.
- 77.
Carter, Robert W. “Patriarchal drive in the early post-Flood population.” Journal of Creation 33(1):110–118. 2019. “It has already been established that the number of mutations passed to children scales with the age of the father. Yet, the oldest fathers in modern world history lived immediately after the Flood.” Carter frames the conclusion for the Y chromosome and says so: “This could potentially explain multiple confounding aspects of the human Y chromosome phylogenetic tree.” The extension to mitochondrial DNA is Cserháti's, not Carter's, and the mechanism does not carry across. A computer model of human population growth that quantifies patriarchal drive, the extra mutations that long-lived fathers pass on in a rapidly growing population. The article uses it as the source Cserháti cites for the mechanism. ↩
- 78.
Carter, Robert W. “The Neandertal mitochondrial genome does not support evolution.” Journal of Creation 23(1):40–43. 2009. “206 nucleotides (1.2% ...), including 195 transitions and 11 transversions”. A young-earth critique of Green's 2008 Neanderthal mitochondrial genome paper, and the most substantial young-earth treatment of this question in print. It is the source of every mechanism discussed above except patriarchal drive. It also gives Green's figures correctly, a year before the web article that miscounted them as 210: ↩
- 78a.
On environmental stress: “It has been suggested by several creationists that the Neandertal population lived in Europe under less-than-ideal conditions and was subjected to nutrient limitations, specifically vitamin D deficiency due to the perpetually cloudy weather during the post-Flood Ice Age. Add a harsh environment and poor nutrition to a small inbreeding population and you have an instant recipe for the rapid accumulation of mutations in any human population.” The underlying claim is Bruce Ames' triage hypothesis, that a starved body diverts resources away from non-critical functions including DNA repair. No magnitude is given, and no measurement of nutritional status raising the human germline mitochondrial mutation rate has been published. ↩
- 78b.
The polymerase mechanism, in full: “Neutral theory does not allow for mutations in DNA polymerase or in anything that affects DNA copying or repair to occur in only a single subpopulation. That would destroy the very notion of a molecular clock, for then mutations would not be expected to accumulate evenly across the board. But we can measure the fidelity of DNA polymerases including the human mitochondrial DNA polymerase, and we know that mutations in DNA polymerases can elevate error rates in human mitochondria.” This is the best-specified mechanism in the young-earth literature on this question, and the only one that names a measurable quantity. ↩
- 78c.
The category slip: “The accumulation of non-synonymous mutations in important genes is evidence for a high mutation rate acting on a small population under threat of extinction.” The finding he is reading is Green's, and Green attributes it to reduced purifying selection, which is less removal, not increased production. Carter does register the caveat that. “the adaptive significance of the synonymous to non-synonymous ratio has recently come under fire.” Elsewhere in the same paper he states the epistemic position the argument rests on: “since we do not know current mutation rates, since we do not know historic mutation rates, and since the assumptions behind the Standard Neutral Model are all questionable, we must conclude that the degree of relatedness of this single Neandertal specimen to modern humans is unknown at this time.” ↩
- 78a.
- 79.
Xia, Huan et al. “Middle and Late Pleistocene Denisovan subsistence at Baishiya Karst Cave.” Nature 632:108–113. 2024. The paper gives the cave's elevation as: “Baishiya Karst Cave (BKC; 35.45° N, 102.57° E, 3,280 metres above sea level) is located in the Ganjia Basin, northeastern Tibetan Plateau.” The new Xiahe 2 rib was assigned to the Denisovan lineage by. “shotgun proteomic analysis”. A research paper on Denisovan subsistence at Baishiya Karst Cave, a cave on the northeastern Tibetan Plateau. Its Denisovan identifications rest on protein evidence and sediment: the new Xiahe 2 rib was assigned to the Denisovan lineage by shotgun proteomic analysis, and the Denisovan presence at the cave rests on the mandible, the rib and sedimentary mitochondrial DNA from layers 2, 3, 4 and 7. The article uses it for the cave's elevation and to show that the high-altitude Denisovan material is protein or sediment DNA rather than specimen genomes. ↩
- 80.
Cosmic-ray dose at altitude, calculated for this article with the formulas printed in the UNSCEAR 2008 report 119. A calculation rather than a single measurement, made with UNSCEAR's own altitude formulas. Sea-level cosmic dose is 31 nGy/h in free air, or about 0.27 mSv per year effective; the population-weighted world averages are 0.28 mSv from the directly ionising component and 0.10 mSv from neutrons, giving 0.38 mSv total against a world population range of 0.3-2 mSv. Altitude scaling uses Bouville and Lowder's expressions as UNSCEAR prints them, with z in kilometres: ionising, E(z) = E(0) x [0.21 exp(-1.649z) + 0.79 exp(0.4528z)]; neutron, E(z) = E(0) x b x exp(az), with b = 1 and a = 1 below 2 km and b = 2 and a = 0.7 above. Working back to sea level from the population-weighted averages (1.25x for the ionising component, 2.5x for neutrons) gives 0.224 and 0.040 mSv, and applying the formulas gives 0.34 mSv per year at 700 m and 1.58 mSv at 3,280 m. The article uses it for the dose at the two cave sites. Annex B, paragraphs 61-66 UNSCEAR supplies a measured check on the same page: “For the same latitude, a variation by a factor of about 4 in the absorbed dose rate in free air was measured in China between sea level and 4,000 m altitude in Tibet.” The formula gives 4.8x at 4 km, so the calculation is right to the accuracy claimed here. Two limits stated plainly. The total-dose column holds terrestrial and dietary sources at the 1,100 µSv Forster measured for Germany and varies only the cosmic term, because altitude is what changes the cosmic term; local geology can move terrestrial dose far more than altitude does, in either direction, and nobody has measured it at either cave. Forster's figures are gonadal dose while UNSCEAR's world average of 2.4 mSv is effective dose, which is why the table is built in Forster's currency rather than mixing the two. Denisova Cave's elevation is not printed in the genetics literature; it is given as about 700 m in the excavation reports, and a digital elevation model returns 683 m at 51.3975° N, 84.6761° E. ↩
- 81.
Forster, Lucy et al. “Natural radioactivity and human mitochondrial DNA mutations.” PNAS 99(21):13950–13954. 2002. A pedigree study of 248 families in Kerala, covering 579 bp of the control region, compared with families on low natural radiation. It counts new heteroplasmies explicitly and exclusively: 22 in 595 high-radiation transmissions against 1 in 200 low-radiation transmissions, and none of the 23 was fixed. The article uses the low-radiation arm as its figure, and uses the study as its test of an environmental insult: a severe natural exposure raised arising mutations without fixing any. ↩ ↩ ↩
- 82.
Kennedy, Scott R. et al. “Ultra-Sensitive Sequencing Reveals an Age-Related Increase in Somatic Mitochondrial Mutations That Are Inconsistent with Oxidative Damage.” PLoS Genetics 9(9):e1003794. 2013. From the abstract: “Surprisingly, G→T mutations, considered the hallmark of oxidative damage to DNA, do not significantly increase with age”. The abstract also says the spectra. “are comprised predominantly of transition mutations, consistent with misincorporation by DNA polymerase γ or deamination of cytidine and adenosine as the primary mutagenic events in mtDNA.” From the Discussion: “We failed to find either a preponderance of G→T/C→A substitutions or a proportionally greater increase with age in this type of mutation relative to other types, despite a span of >80 [years].” A laboratory method paper that applied Duplex Sequencing, which detects one mutation among more than 107 wild-type molecules, to human brain mitochondrial DNA from young and old donors. The authors note that the mutation spectrum matches what is seen in population and phylogenetic data. The article uses it to show that the chemistry of oxidative damage is not what generates mitochondrial mutations, and the point is about which chemistry makes mitochondrial point mutations, not about the germline rate, since this is somatic brain tissue. ↩
- 83.
Zhang, Dongju et al. “Denisovan DNA in Late Pleistocene sediments from Baishiya Karst Cave on the Tibetan Plateau.” Science 370(6516):584–587. 2020. From the abstract: “We recover Denisovan mitochondrial DNA from sediments deposited ~100 thousand and ~60 thousand years ago (ka) and possibly as recently as ~45 ka. The long-term occupation of BKC by Denisovans suggests that they may have adapted to life at high altitudes and may have contributed such adaptations to modern humans on the Tibetan Plateau.” A 2022 review of the plateau evidence puts the same limit on it: “the mtDNA retrieved from sediments is unable to identify genomic variants relevant to high-altitude adaptation.” A study that recovered Denisovan mitochondrial DNA from cave sediment, not from a bone. The point is what kind of evidence this is: sediment DNA establishes that Denisovans were present, but it is not a specimen genome, so it adds no branch to the mitochondrial phylogeny. The article uses it to show that the high-altitude mitochondrial sequences came from cave sediment. ↩
- 84.
Trifunovic, Aleksandra et al. “Premature ageing in mice expressing defective mitochondrial DNA polymerase.” Nature 429(6990):417–423. 2004. A laboratory study in which mice were engineered to carry a proofreading-deficient version of the mitochondrial DNA polymerase. It is the mtDNA mutator mouse, and the only measurement of what a broken mitochondrial polymerase actually does to the mutation rate. PubMed ID 15164064. The article uses it because it measured the effect in exactly the system the critic names. ↩
- 84a.
From the abstract: “we created homozygous knock-in mice that express a proof-reading-deficient version of PolgA, the nucleus-encoded catalytic subunit of mtDNA polymerase. Here we show that the knock-in mice develop an mtDNA mutator phenotype with a threefold to fivefold increase in the levels of point mutations, as well as increased amounts of deleted mtDNA.” Two details matter for the young-earth application, and both are in that sentence. The magnitude is three to five, against a requirement of 5.7 to 11.4. And PolgA is nucleus-encoded, so the allele is inherited from both parents and would have crossed into the modern human population through the interbreeding the young-earth position requires. The mice also show premature ageing, reduced lifespan and reduced fertility, so this is not a cost-free proposition for a population that has to run it for millennia. ↩
- 84a.
- 85.
The arithmetic behind the mutator price. Stewart 2008's descendants carried about 29.8 mutations each, every one scored at 25% or more of the copies 39. A neutral variant at frequency f eventually takes over a followed lineage with probability f, so 29.8 × 0.25 is about 7.5 lasting changes if all were made in one germline generation, 3.7 if spread over two, and 2.5 if spread over three. Dividing Behar's 57.1 root-to-tip changes 22 by those figures gives about 8, 15 and 23 generations, or 190 to 575 years at 25 years a generation. For comparison, Trifunovic's three- to fivefold somatic increase applied to the measured rates of lasting change, 0.0054 to 0.0114 per generation, gives 0.016 to 0.057 per generation and 1,000 to 3,500 generations. Purifying selection would remove some of the mutator's output; the dN/dS figures in Stewart 2008 suggest a discount of a quarter to a half. The full working is in research/young-age-evidence-2026-10-27.md. ↩ ↩
- 86.
Ross, Jaime M. et al. “Germline mitochondrial DNA mutations aggravate ageing and can impair brain development.” Nature 501(7467):412–415. 2013. A mouse study from the laboratory that built the mutator mouse, breeding lines in which mitochondrial mutations made by a proofreading-dead polymerase were passed down the maternal line. The inherited mutations caused mild ageing in mice with normal nuclear genes and, in mice carrying one mutator copy, fertility that fell over the generations. The article uses it for the price a mutator burst would carry. ↩ ↩
- 87.
Castellano, Sergi et al. “Patterns of coding variation in the complete exomes of three Neandertals.” PNAS 111(18):6666–6671. 2014. The last two authors are Svante Pääbo and Carles Lalueza-Fox. The El Sidrón and Vindija exomes were at 12.5-fold and 42.0-fold average coverage, and were analysed with the 52-fold Altai genome. The authors ran the obvious enrichment test on these catalogues and reported that. “genes involved in skeletal morphology have changed more in the lineage leading to Neandertals than in the ancestral lineage common to archaic and modern humans, whereas genes involved in behavior and pigmentation have changed more on the modern human lineage.” The words "repair" and "replication" do not occur anywhere in the paper. A 2014 study that captured the protein-coding DNA of 17,367 genes from two Neandertals, one from El Sidrón Cave in Spain and one from Vindija Cave in Croatia, and compared it with the genome of a Neandertal from southern Siberia. It is the source of the amino-acid change catalogues the article uses. The article uses it for those catalogues, and for the enrichment test that its authors ran on them. Mirror: Eva.mpg.de ↩
- 88.
Scan of a 206-gene DNA-repair panel in the Neanderthal exomes and Altai genome. Original to this article: a scan of a 206-gene panel of DNA-repair and replication genes against the published Neanderthal change catalogues and translated exome proteins, run in two independent passes. The catalogues are annotated with PolyPhen-2, SIFT, GERP, 1000 Genomes frequencies and great-ape ancestral alleles. The article uses it as its search for a repair defect in the Neanderthal lineage. Amino-acid changes were re-annotated against current Ensembl VEP because PolyPhen has been retrained since 2014; TEFM Asp320His, for instance, has fallen from "probably damaging (0.983)" to "possibly damaging (0.65)". Four limitations. The catalogues are single-nucleotide only, so a frameshift mutator allele would not appear. Regulatory change was not assessed. Coverage is too thin to conclude anything in POLRMT (28% of residues called), RNASEH1 (12%), SPG7 (24%) and a handful of others, and POLRMT is the one that matters, since it lays down the replication primer. Chagyrskaya 8 could not be included, because its VCF files on the EVA server are plain gzip rather than the block format their shipped tabix indexes assume. ↩
- 89.
Farnum, Gregory A. et al. “Mapping 136 pathogenic mutations into functional modules in human DNA polymerase γ establishes predictive genotype-phenotype correlations for the complete spectrum of POLG syndromes.” Biochimica et Biophysica Acta 1837(7):1113–1121. 2014. A structural survey that mapped 136 dominant and recessive disease mutations of the mitochondrial DNA polymerase onto its three-dimensional structure and sorted them into functional clusters. One cluster, residues 561 to 617 in the spacer's processivity subdomain, lines the channel that binds DNA, and mutations in the polymerase's fingers subdomain lower copying accuracy without touching the proofreading site. It did not test Leu580Pro; the article uses it to show that a change outside the proofreading site can still matter. ↩
- 89a.
Section Introduction: “Cluster 2 mutations are predicted to cause a primary defect in DNA binding affinity, and affect residues of the IP and AID that form the upstream DNA binding channel”. Section Results: “The accessory (subunit) interacting domain (AID, residues 476-570) and the intrinsic processivity (IP, residues 571-784) subdomains of the spacer domain are colored in magenta.” “POLG mutations that disrupt the specific contacts with the incoming dNTP (H932Y, R943H, K947R, Y951N, and Y955C) will reduce fidelity and increase Km (dNTP), without affecting DNA binding affinity”. The second quotation is from a figure legend. Residue 580 falls in the processivity subdomain and in the cluster's stretch of residues 561 to 617. ↩ ↩
- 89b.
Section Introduction: “Late onset POLG syndromes, such as progressive external ophthalmoplegia (PEO) can be caused by dominant or recessive compound heterozygous mutations”. ↩
- 89a.
- 90.
UniProt. DNA polymerase subunit gamma-1 (P54098, DPOG1_HUMAN). n.d. The annotated sites are the exonuclease active site at Asp198; exonuclease motifs Exo I 196-200, Exo II 267-275 and Exo III 395-403; and polymerase motifs Pol A 887-896, Pol B 943-958 and Pol C 1134-1141. Residue 579 is annotated as an RNA-primer binding residue and 593 as a template-strand binding residue. The three natural variants UniProt records between residues 570 and 600 are R574W (autosomal-recessive progressive external ophthalmoplegia, dbSNP rs774474723), R579W (the same condition, rs556925652) and P587L (that condition plus mitochondrial DNA depletion syndromes 4A and 4B, rs113994096). The Neanderthal change itself is dbSNP rs1463396518. The protein database entry for the main subunit of the human mitochondrial DNA polymerase, which copies mitochondrial DNA. It lists the enzyme's 1,239 residues, its active sites and motifs, and the natural variants recorded in each region. The article uses it for the point that the stretch between residues 570 and 600 sits beside working parts of the enzyme and carries only recessive disease variants. ↩
- 91.
Aneli, Serena et al. “Functional characterization of archaic-specific variants in mitonuclear genes: insights from comparative analysis in S. cerevisiae.” Human Molecular Genetics 33(13):1152–1163. 2024. The last two authors are Paola Goffrini and Cristian Capelli. One variant had a real effect, in YARS2, the mitochondrial tyrosyl-transfer-RNA synthetase, giving reduced respiratory activity and lower Cox2. That is a fault in mitochondrial translation, not in replication or repair, and the phenotype is respiratory deficiency rather than an elevated mutation rate. A 2024 study that tested archaic-specific gene variants in yeast, rather than only predicting their effects. The authors searched mitochondria-related nuclear genes for non-synonymous, fixed, archaic-derived variants that are rare or absent in living humans, expressed the archaic and human versions in yeast, and measured the result. The article uses it as the nearest existing experiment, since nobody has yet run POLG Leu580Pro through a yeast assay. ↩
- 92.
The POLG Foundation. A variant-to-function map of POLG via deep mutational scanning. n.d. A project page for a funded deep mutational scan, led by Vamsi Mootha and Anna Kotrys at the Broad Institute, that aims to measure how coding variants of the polymerase gene affect mitochondrial respiration. It states an aim and publishes no result for Leu580Pro. ↩
- 93.
Qian, Yufeng et al. “Alpers disease mutations in human DNA polymerase gamma cause catalytic defects in mitochondrial DNA replication by distinct mechanisms.” Frontiers in Genetics 6:135. 2015. A biochemistry study that purified the human mitochondrial DNA polymerase carrying two Alpers disease mutations, S305R and P1073L, and measured polymerization, fidelity and replication separately in a reconstructed system. It did not test Leu580Pro; the article uses it to show that the measurement Leu580Pro needs has been made for other variants. ↩
- 94.
Kaliszewska, Magdalena et al. “Yeast model analysis of novel polymerase gamma variants found in patients with autosomal recessive mitochondrial disease.” Human Genetics 134(9):951–966. 2015. A yeast study that introduced the equivalents of human polymerase variants from patients into the yeast gene MIP1 and measured their effect on mitochondrial DNA. The article uses it as an example of a yeast route to testing a variant like Leu580Pro, whose results would not carry over to human germline transmission by themselves. ↩
- 95.
Scan of a 206-gene DNA-repair panel in the Denisova 3 genome. Original to this article: a scan of a 206-gene panel, run against the high-coverage Denisova 3 genome, with the surviving candidates re-genotyped in a combined exome file. It finds 222 rows that collapse to 178 distinct variants, of which 89 are rare or absent in gnomAD and 78 are common, and four loss-of-function calls. The article uses it to show that three signatures identify almost all of those Denisovan calls as artifacts. The combined file carries the Altai, Vindija and El Sidrón Neanderthals, the Denisovan and nine present-day human exomes, with a chimpanzee ancestral allele per site. Deamination classes (C→T, G→A) are 44/88 = 50.0% of the rare set against 22/78 = 28.2% of the common set. The heterozygote share is 64% against 14%, at median depth 27 against 30. PolyPhen and SIFT are prediction programs that score whether a change is likely to damage a protein. PRIM2 carries 14 of the 89 rare variants and three of the four loss-of-function calls. The highest PolyPhen score across the 19 core mtDNA-fidelity genes is 0.414 (OGG1 Lys198Arg, benign), and all 13 protein-changing variants are also SIFT-tolerated. Coverage: 57,731 coding bases, 99.9% with a called genotype and 97.9% at read depth DP>=10, with the weakest genes POLRMT 87.1%, UNG 91.0% and RNASEH1 92.7%. Two corrections made in the course of this work. TWNK, C10orf2 and PEO1 are three symbols for one gene, so an earlier count of 21 core genes was really 19. The first scan also silently skipped eight panel genes whose Ensembl coding-sequence lookup failed, POLRMT and WRN among them. Six of the eight could be recovered, and POLRMT was scanned separately by genomic region, giving 7 variants: 4 synonymous, 2 benign missense, and one position at DP 3 that cannot be called. WRN remains unscanned in the Denisovan. The panel files LIG1 under base-excision repair as a mitochondrial pathway. That is right for the nucleus and wrong for mitochondria, where the ligase is LIG3, so the four LIG1 hits should not have counted as mitochondria-relevant. ↩
- 96.
The regional and site-class ratios divide the mean human-Neanderthal distance by the mean human-human distance within the same sites, in this article's panel of 54 living humans and 36 Neanderthals, so any difference in rate between regions or site classes cancels. Site classes use the number of independent branches of PhyloTree Build 17 on which each position mutates. The counts are in
research/data/site-class-analysis.mdandresearch/data/site-class-positions.tsv. ↩ - 97.
Posth, Cosimo et al. “Deeply divergent archaic mitochondrial genome provides lower time boundary for African gene flow into Neanderthals.” Nature Communications 8:16046. 2017. The authors' two stated reasons for their failed attempt are sound. Late Neanderthal radiocarbon dates sit at the limit of the method, and the eight dated specimens have mean ages spanning only about 3,000 years, from roughly 41 to 44 ka, which is nowhere near enough time depth to calibrate a tree whose divergences are hundreds of thousands of years deep. The same paper's formal model comparison, by stepping-stone and path sampling on 54 modern human, 18 Neanderthal and 1 Denisovan mitochondrial genomes, selected a strict clock, one rate on every branch, over an uncorrelated lognormal relaxed clock, which lets the rate differ from branch to branch. That is the Bayes-factor version of the same question, a comparison of how well each model fits the data, and it goes the same way as the relative-rate test. The authors' admission reads: Section Supplementary Note 4, Mutation rate mtDNA: “BEAST runs did not converge or provided a non-realistic rate of one order of magnitude lower than observed for modern humans.” A paper that sequenced a new Neanderthal mitochondrial genome from a femur found in the Hohlenstein–Stadel cave in the Swabian Jura of southwestern Germany, and used its deep divergence to push back the earliest possible date for an African gene flow into Neanderthals. The article uses it for the authors' own admission that nobody has yet measured a Neanderthal mutation rate directly. Mirror: PMC ↩
- 98.
Fotiadou, Charoula M. et al. “Archaeogenetic insights into the demographic history of Late Neanderthals.” PNAS 123(13):e2520565123. 2026. The last author is Cosimo Posth. The authors write of the Les Cottés Z4-1514 individual, which branches basally, that it. “has accumulated the greatest number of substitutions among all Neanderthals.” The same individual dates molecularly to 64 ka against a direct radiocarbon date of 43,740-42,720 cal BP, an apparent local acceleration of about 1.5-fold, though the 95% interval (91-41 ka) overlaps the direct date. On the general question, they write: “Since there might be substantial rate variation among tree branches, we cannot establish if the short branch length observed for Thorin is due to an older date, a faster mutation rate along its mtDNA lineage, or both.” They add that they are. “currently limited in our ability to calibrate deep events in the Neanderthal mtDNA tree by the scarcity of radiocarbon dated individuals falling on more deeply divergent branches.” A 2026 study that sequenced ten new Neanderthal mitochondrial genomes from six archaeological sites in Belgium, France, Germany and Serbia, and analysed them alongside 49 published ones. The authors date the diversification of the Late Neanderthal lineage to about 65 ka, and still use the modern human coding-region rate of 1.57 × 10⁻⁸ per site per year. The article uses it for two sentences in which the authors concede the limits of their own dating, and quotes them as the other side's words. ↩
- 99.
Meyer, Matthias et al. “A mitochondrial genome sequence of a hominin from Sima de los Huesos.” Nature 505(7483):403–406. 2014. A research letter in Nature that sequenced the almost complete mitochondrial genome of a hominin from a femur (thigh bone) at Sima de los Huesos, Spain, and found it closely related to the lineage leading to Denisovans. The authors dated the specimen from the length of its mitochondrial branch alone to roughly 400,000 years, with estimates from 0.15 to 0.64 million years. A later paper by the same group (Meyer et al. 2016) found the nuclear DNA to be Neanderthal while the mitochondrial DNA is Denisovan-like, one of two documented cases in which the mitochondrial tree does not track the population history, and a fair point for a critic of the mitochondrial clock to press. The article uses it to set the mitochondrial date against an independent physical date. ↩
- 100.
Arnold, Lee J. et al. “Luminescence dating and palaeomagnetic age constraint on hominins from Sima de los Huesos, Atapuerca, Spain.” Journal of Human Evolution 67:85–107. 2014. A dating study of the Sima de los Huesos deposit using two physical methods, luminescence dating and palaeomagnetism. It gives a minimum age of 427,000 ± 12,000 years for the deposit, from methods sharing no assumptions with the molecular estimate. The molecular and physical dates agree to within 7%, and no young-earth response to this result appears in the literature. The article uses it as the physical check on the mitochondrial date. ↩
- 101.
Wang, Richard J. et al. “Human generation times across the past 250,000 years.” Science Advances 9(1):eabm7047. 2023. Generation intervals inferred from the de novo mutation spectrum are 26.9 ± 3.4 years overall, 30.7 ± 4.8 for males and 23.2 ± 3.0 for females. By continental group, the paper reports: “a significantly shorter sex-averaged generation interval for East Asian, European, and South Asian populations—20.1 ± 3.9, 20.6 ± 3.8, and 21.0 ± 3.7 years—compared to the African population, 26.9 ± 3.5 years (P < 1 × 10⁻¹⁰, t test).” African intervals are longer, not shorter, which is the reverse of what the young-earth generation-time argument requires. A genetics study that estimated how long human generations have been over the past 250,000 years, from the spectrum of de novo mutations (the new changes that appear in a child's DNA and are not inherited). Its African generation intervals are longer, not shorter, than those of East Asian, European and South Asian populations, which is the reverse of what a short-generation argument requires. The article uses it to answer a 2016 argument that needs fifteen-year generations. Mirror: Par.nsf.gov ↩
- 102.
Howell, Neil et al. “How rapidly does the human mitochondrial genome evolve?” American Journal of Human Genetics 59(3):501–509. 1996. Page 501: “triplasmic descendants with three mitochondrial genotypes”. Both mutations produced these descendants, which are heteroplasmic (carry more than one mitochondrial type), not fixed. A pedigree study that opened the pedigree-rate literature. It sequenced the D-loop (control region) of 45 members of a large matrilineal Leber hereditary optic neuropathy pedigree and found two germline mutations in 88 transmissions, normalised here as 2/88 over 1,122 bp of control region. The article uses it as one row of its table of pedigree rates. ↩
- 103.
Cavelier, Lucia et al. “MtDNA substitution rate and segregation of heteroplasmy in coding and noncoding regions.” Human Genetics 107(1):45–50. 2000. The study reports: “No homoplasmic nucleotide substitutions were detected in a total of 292 transmissions.” The forgotten null result, and the first study to count fixed changes specifically. The article uses it as the no-fixed-changes row of its table of pedigree rates. ↩
- 104.
Sigurðardóttir, Sigrún et al. “The mutation rate in the human mtDNA control region.” American Journal of Human Genetics 66(5):1599–1609. 2000. A pedigree study of the control region of mtDNA in 272 people from 26 large Icelandic family trees, covering 705 mother-to-child transmissions, which found 3 substitutions. Howell 2003 re-scored the same dataset as 5 by counting newly arising heteroplasmies as well, which shows the arising-versus-fixing distinction inside a single dataset. The article uses it as one row of its table of pedigree rates. ↩
- 105.
Heyer, Evelyne et al. “Phylogenetic and familial estimates of mitochondrial substitution rates: study of control region mutations in deep-rooting pedigrees.” American Journal of Human Genetics 69(5):1113–1126. 2001. The authors write that hypermutable sites. “are expected to be of no or little informativity for the evaluation of mutational distances at the phylogenetic time scale.” A pedigree study of control region mutations in deep-rooting French-Canadian family trees, which found 4 substitutions in 508 maternal transmissions over 673 bp. Its more important result is the pooled one: of 18 substitutions in 1,729 transmissions, only 12 were at independent sites, because three positions had each mutated twice. The article uses it as the direct empirical rebuttal to any argument that extrapolates a control-region pedigree count backwards. ↩
- 106.
Santos, Cristina et al. “Understanding differences between phylogenetic and pedigree-derived mtDNA mutation rate: a model using families from the Azores Islands (Portugal).” Molecular Biology and Evolution 22(6):1490–1505. 2005. The authors write: “Eleven new point substitutions were found, all of them in heteroplasmy, from which five appear to be somatic mutations and six can be considered germinal.” The last-named author is Aluja, María Pilar. A pedigree study of Azores families, built as a model to explain why phylogenetic and pedigree mutation rates differ. It is the first study to correct an arising count into a fixing rate explicitly, and zero reached homoplasmy. The tabulated rate is the corrected figure, a model output; the raw data are 6 germinal mutations in 321 transmissions. The article uses it as its model-corrected Azores row. ↩
- 107.
Horai, Satoshi et al. “Recent African origin of modern humans revealed by complete sequences of hominoid mitochondrial DNAs.” PNAS 92(2):532–536. 1995. A research paper that sequenced the complete mitochondrial DNA of three humans, three African apes and an orangutan to estimate how fast hominoid mtDNA changes and when modern humans shared a common ancestor. The calibration is two steps removed from anything datable: the orangutan and African ape split is fixed at 13 million years, and the human-chimpanzee split of 4.87 ± 0.23 million years (Myr) comes out of that. The paper's own data give two irreconcilable dates for the human ancestor: 143,000 ± 18,000 years from synonymous sites and the D-loop, and 450,000 ± 70,000 from nonsynonymous and RNA-gene sites. Only the first is ever quoted. The article uses it in its table of rate estimates, where it gives both dates. ↩
- 108.
Mishmar, Dan et al. “Natural selection shaped regional mtDNA variation in humans.” PNAS 100(1):171–176. 2003. The last-named author is Wallace, Douglas C. A study of 104 complete mtDNA genomes from all global regions, arguing that natural selection, with climate as one influence, shaped regional mtDNA variation. The measured quantity is a ratio: human tree depth to the human-chimpanzee ancestor, 24.88 against 818.05 × 10⁻⁴ substitutions per nucleotide, or 1 : 32.8, and the 198 ka date comes from fixing the denominator at 6.5 Myr. Its separate claim of climate-driven selection on ATP6 rests on counts as small as 3 versus 7 nonsynonymous changes and was not reproduced by Kivisild 2006. The article uses it for its 198 ka row, the date that the human-chimpanzee calibration gives. ↩
- 109.
Brotherton, Paul et al. “Neolithic mitochondrial haplogroup H genomes and the genetic origins of Europeans.” Nature Communications 4:1764. 2013. The last-named authors are Cooper, Alan and the Genographic Consortium. A study of 39 complete haplogroup H genomes from Central European skeletons dated 5500-2000 BC. Every calibration point sits inside the dendrochronologically anchored part of the radiocarbon curve, with no Pleistocene sample, no ape split and no Out-of-Africa node, and a date-randomisation test confirmed the dates carry enough signal. The authors note their 2.4 × 10⁻⁸ is 1.45x the ape-calibrated 1.66 × 10⁻⁸. The article uses it as its Holocene-only calibration row. ↩
- 110.
Posth, Cosimo et al. “Pleistocene mitochondrial genomes suggest a single major dispersal of non-Africans and a Late Glacial population turnover in Europe.” Current Biology 26(6):827–833. 2016. The last-named author is Krause, Johannes. A study that recovered 35 new mitochondrial genomes from Late Pleistocene and early Holocene European hunter-gatherers. It used 66 radiocarbon-dated ancient genomes as tip calibrations alongside 311 modern ones, spanning 3,600 to 46,880 cal BP, with roughly a third of the calibration points Holocene. Four model combinations give 2.62, 2.67, 2.74 and 2.77 × 10⁻⁸; the preferred Bayesian-skyline strict-rate model gives 2.74 × 10⁻⁸ (2.44-3.01 HPD). The article uses it as its table row for that model. ↩
- 111.
Cabrera, Vicente M. “Human molecular evolutionary rate, time dependency and transient polymorphism effects viewed through ancient and modern mitochondrial DNA genomes.” Scientific Reports 11:5036. 2021. A direct count of mutation differences between 423 radiocarbon-dated ancient genomes and 784 modern ones, binned into ten age periods, with no phylogenetic model at all. Mean differences rise with age, almost monotonically (one small dip, from 1.63 to 1.51, at the fourth period): 0.63 at 1,119 BP, 3.28 at 8,504, 11.07 at 29,638, 14.39 at 40,160, which is arguably the cleanest single table in the subject. Flagged discrepancy: the rates in its Table 2 cannot be reproduced from Table 1 by the paper's own stated formula, and reverse-engineering implies mutually inconsistent sequence lengths that are never stated. The direction and monotonicity are not in doubt; the exact rate figures are not reproducible from published numbers, and are tabulated here with that caveat. The article uses its youngest and oldest bins as two rows of its rate table. ↩ ↩
- 112.
Pairwise substitution counts by region for living humans, Neanderthals and Denisovans. Original to this article: a table of mean and maximum pairwise substitution counts for each region of the mitochondrial genome, across 54 modern human genomes (the revised Cambridge Reference Sequence plus Ingman's 53), 36 Neanderthal and 7 Denisovan mitogenomes, all projected onto revised Cambridge Reference Sequence coordinates with the three length-polymorphic tracts (303–315, 16,184–16,193 and 8,281–8,289) excluded. The article uses it for the region-by-region root-to-tip depths in its table, one row each for living humans, Neanderthals, Denisovans and all three together. The regions are HVR-I 16,024–16,383 (350 comparable sites), HVR-II 57–372 (303), the rest of the control region (445) and coding 577–16,023 (15,435). "Rest" is the control region minus the two hypervariable segments. Each region's root-to-tip depth is 57.1 × (region mean pairwise ÷ whole-molecule mean pairwise, 59.4). This assumes each region contributes to root-to-tip depth in the same proportion as to pairwise differences, an approximation stated so that it can be checked. Average-pair coalescences in the last four rows are per-site mean pairwise ÷ (2 × 1.665 × 10⁻⁸). ↩ ↩
- 113.
Brown, Samantha et al. “The earliest Denisovans and their cultural adaptation.” Nature Ecology & Evolution 6:28–35. 2022. A dating and ancient-DNA study of the oldest Denisovan remains from Denisova Cave. It places the layer holding Denisova 19 at 187,000 to 217,000 years (95.4% interval) and finds that Denisova 19 and 21 carry identical mitochondrial DNA. These are ages of the layer, not direct dates of the individuals; the article uses them for its one check of a rate against a fossil's age. ↩
- 114.
The eighteen-fold maternal-age figure, worked out for this article. A calculation made for this article, not a number that any paper reports. Of its three inputs, one is measured and two are choices rather than measurements. The article uses it to price the maternal-age effect at older ages, setting the exponential fit the paper used beside the straight line it never tested. The one measured input, in Rebolledo's words 33: “the number of point heteroplasmies tripling over 30 y of life.” Poisson regression's default log link makes the fitted model log(count) = a + b x age, so the count grows as exp(b x age). The published tripling fixes the growth rate: exp(30b) = 3, so b = ln(3)/30 = 0.0366 per year. From age 20 to age 100 is 80 years, or 80/30 = 2.67 tripling-periods, giving 32.67 = 18.7. The other rows of the table are the same formula at other ages. First choice: the exponential shape. It is Poisson regression's default link, not a tested result, since no functional form is compared in either paper. Refit as a straight line and the same tripling gives 1 + 80 x (2/30) = 6.3 at age 100, so about two-thirds of the headline number comes from the link function alone. Second choice: the age-100 endpoint. It is supplied by the young-earth longevity model, not by any data. It is used here because it is the most generous reading available to that position, and the position still has to answer the objection that Genesis records no maternal ages at all. ↩
- 115.
Every substitution in PhyloTree Build 17 63, indels and uncertain calls excluded, binned by how far below the reconstructed root its branch starts. Transversions make up 3.4% of the 29 substitutions on branches starting 0 to 9 below the root, 6.5% of 139 at 10 to 19, 3.8% of 158 at 20 to 29, 4.8% of 871 at 30 to 39, and 4.3% of the 10,502 deeper ones; in the first 30 below the root, 3.6% in the coding region and 8.9% in the control region. A random base change would be a transversion two times in three. The script is research/code/depth_spectrum.py; it uses the article's PhyloTree parser. ↩
- 116.
Wood, Todd Charles. “Mitochondrial DNA Analysis of Three Terrestrial Mammal Baramins (Equidae, Felidae, and Canidae) Implies an Accelerated Mutation Rate Near the Time of the Flood.” Proceedings of the Seventh International Conference on Creationism. Creation Science Fellowship. 2013. A creationist analysis by a leading young-earth biologist of published mitochondrial DNA from living and Pleistocene horses, cats and dogs, with the ancient specimens' radiocarbon dates recalibrated into a post-Flood chronology. It concludes that mutation ran fast just after the Flood and has been low since, and it tests and rejects the alternative that heteroplasmy on the Ark explains the diversity. The article uses it as the young-earth burst model in its author's own words.
- 116a.
Section Discussion: “the similarity of aDNA from Pleistocene specimens to modern mitochondrial DNA implies a rapid sequence diversification from the time of the Flood to the time the fossils were formed. Since then, DNA divergence has been low, since these ancient sequences closely resemble their extant counterparts. Thus, these results imply a period of rapid genetic divergence after the Flood that quickly decreased to the low mutation rates characteristic of the present.” ↩
- 116b.
Section Discussion: “Alternatively, these results could be interpreted as the result of heteroplasmy in the animals aboard the Ark, wherein different mtDNA types were sorted into different lineages”. “Since the broad intrabaraminic relationships inferred from morphology do reflect mtDNA similarity, this relict mtDNA hypothesis can be ruled out, and instead, the hypothesis of rapid mtDNA divergence is supported.” ↩
- 116c.
Section Discussion: “The recalibration used here places twelve of the specimens within seven decades of the Flood, but four of those specimens were dated to the Flood itself. Since the Upper Pleistocene is unquestionably post-Flood, the recalibration used here cannot be precisely correct”. ↩
- 116a.
- 117.
Rohde, Douglas L. T. et al. “Modelling the recent common ancestry of all living humans.” Nature 431:562–566. Sep 30, 2004. Their conservative simulation gives a mean genealogical most recent common ancestor at 1415 BC and a mean identical-ancestors (IA) point, when everyone alive shares the same set of ancestors, at 5353 BC; less conservative migration parameters give AD 55 and 2158 BC. Their own caveat: “because DNA is inherited in relatively large segments from ancestors, an individual will receive little or no actual genetic inheritance from the vast majority of the ancestors living at the IA point.” A mathematical and computer-simulation study of how far back the ancestors of everyone alive today converge, using models with population substructure, such as people preferring mates from their own social group. It finds that the most recent common ancestor of all present-day humans lived only a few thousand years ago in these models. The article uses it as a mainstream result that puts a universal genealogical ancestor a few thousand years back. Mirror: Stat.yale.edu ↩
- 118.
Hein, Jotun. “Human evolution: Pedigrees for all humanity.” Nature 431:518–519. 2004. The commentary says that universal genealogical ancestry. “does not imply that an individual makes a significant genetic contribution to the present population. In fact, that individual might have contributed nothing.” A News and Views commentary on the study by Douglas Rohde and colleagues, by Jotun Hein of the Department of Statistics at the University of Oxford. It gives the shortest correct statement of why that result does not bear on mitochondrial Eve. The article uses it for that point, since genealogical ancestry is not the same as genetic contribution. Mirror: Stat.yale.edu ↩
- 119.
UNSCEAR. Sources and Effects of Ionizing Radiation, UNSCEAR 2008 Report Volume I, Annex B: Exposures of the public and workers from various sources of radiation. United Nations, New York. 2008 (edition of 2010). The United Nations scientific committee's annex on radiation exposures of the public and of workers, including how cosmic-ray dose rises with altitude. The article takes its altitude formulas and world-average doses from it for the comparison with Baishiya Karst Cave. ↩