"Since most mutations, if they have any effect at all, are harmful, the overall impact of the mutation process must be deleterious." — James Crow, University of Wisconsin1
"Some unconditionally deleterious mutations of smaller effect size will inevitably fix, producing cumulative degradation termed 'Ohta's ratchet'." — Matheson, Hernández, Bertram and Masel, University of Arizona, 20252
"If substitutions at 10% of all nucleotide sites have selection coefficients within this range with the mean 10-6, an average individual carries approximately 100 lethal equivalents." — Alexey Kondrashov, asking why we have not died a hundred times over3
Overview
Every human is born with roughly 70 new mutations that neither parent had.4 5 Some fraction of them land in DNA that is doing a job, and when a mutation lands in working DNA it is far more likely to break something than improve it. Natural selection removes the worst of them. But selection is not a microscope. It cannot see a mutation whose effect on survival is smaller than the ordinary noise of luck, and the size of that blind spot is set by population size.
The claim called genetic entropy is that a large fraction of harmful mutations fall inside that blind spot, so they accumulate permanently, generation after generation, and the genome degrades.
Three things about that claim need separating, because they are usually run together and only one of them survives scrutiny.
- The load argument — that the sheer number of harmful mutations should already have killed us. This one does not work. It depends on comparing every human to a hypothetical mutation-free human who does not exist, and mainstream population geneticists have a good answer to it. This article explains their answer and concedes the point.
- The ratchet argument — that mutations too weak for selection to see fix permanently in the whole species, one after another, forever. The fixations are real and counted, by mainstream labs, and that part is not in dispute. Whether "degrading" is the right word for them is disputed, and this article takes on the best version of the objection.
- The accounting argument — that this destroys specific genetic information faster than evolution builds it. This one is live and unsettled, and it is where the real disagreement now is.
The number that decides everything is U: how many harmful mutations each person gets per generation. Mainstream estimates run from about 2 to about 10.6 2 If the human genome is more functional than the low end assumes, U is higher.
What both sides now agree on
This debate has moved, and the movement is worth stating plainly, because the popular versions on both sides are ten years out of date.
In 2025 a team at the University of Arizona led by Joanna Masel — no creationists, funded in part by the NIH and the John Templeton Foundation — simulated a human-scale population for 200,000 generations to test exactly this question. (Their paper is a preprint, not yet peer reviewed, and that should be weighed.) They counted 56,255 harmful mutations that fixed permanently against 6,387 beneficial ones.2 They call the process Ohta's ratchet, they treat it as real, and their paper is titled to reassure: the population survives.
It survives, in their model, because the beneficial fixations were individually about a hundred times larger in effect than the harmful ones, so the books balance. Their own words: "the accumulation of mildly deleterious fixations (Ohta's ratchet) is countered by a smaller number of larger-effect beneficial fixations under quite conservative assumptions."2
So the question is no longer whether mutations classified as deleterious fix permanently. On the counts, both sides agree. The questions now are:
- Is the beneficial mutation rate their answer requires one that anyone has measured? Their own paper says "there is great uncertainty in the true values of U_b and s̄_b."2
- Does compensation restore lost information, or only mask it? A better chaperone protein that stops a hundred slightly-misfolded proteins from causing trouble is a real fix for fitness. It does not restore the hundred specific sequences that were degraded.
One caution before going further, because it is the strongest thing that can be said against this whole article. A major school of population genetics denies that "degrading" describes those fixations at all. Nick Barton, in PNAS in 2022, names both the drift barrier and Kondrashov's version of this argument and rejects the framing outright:
"Lynch (21) has applied this concept to argue that molecular adaptations that are under weak selection cannot be established or maintained in (relatively) smaller populations, imposing a 'drift barrier' to adaptation. Along the same lines, Kondrashov (55) has argued that deleterious mutations with N_e s ≈ 1 will accumulate, steadily degrading the population. Both ideas seem problematic if we view adaptation as due to optimization of polygenic traits: Organisms can be well adapted even if drift dominates selection on individual alleles, and, under a model of stabilizing selection on very many traits, any change that degrades fitness can be compensated."7
That is not a fringe position and it is not answered by counting fixations. It gets a full section below, because it — not truncation selection — is the objection this argument actually has to survive.
What this article does
It works the numbers out in the open, and it gives you a simulator to check them with. Every headline figure below comes out of standard population genetics — Kimura's diffusion equations, Haldane's load formula, Watterson's estimator — with parameters taken from mainstream measurements, and the code that produces them runs in your browser at Drift Lab.
It also says plainly where the creationist case is weak. John Sanford's book Genetic Entropy, which put this argument on the map, contains a quotation of a Nature paper that deletes the conditional clause the authors' whole conclusion depends on. That is documented below, with both versions side by side. A reader who suspects creationists of quote-mining should be able to find that out here rather than somewhere else.
Three arguments that get called genetic entropy
Most of the confusion in this subject comes from three separate claims wearing the same name. They have different evidence, different opponents, and different verdicts.
| The claim | Verdict | |
|---|---|---|
| Load | So many harmful mutations arrive each generation that the species should not be viable at all | Fails. Assumes a comparison to a genotype that does not exist |
| Ratchet | Mutations too weak for selection to see fix permanently, one after another, in sequence that was doing a job | Holds for the fixations. Both sides count them. Whether they amount to degradation, and where they stop, is disputed |
| Accounting | Degradation outpaces construction, so evolution cannot have built the information in the first place | Unsettled. Turns on the sign and size of mutations too small for any instrument to resolve |
Taking them in order.
The four numbers everything depends on
How many mutations
Direct sequencing of parents and their children settled this. A 2012 study of 78 Icelandic trios found an average of 63.2 new mutations per child at a paternal age of 29.7 years, rising by about 2 mutations for every year of the father's age.4 A larger deCODE study in 2017 confirmed the pattern.5 Long-read sequencing in 2025 pushed the count of all new genetic changes — including repeat-length changes and structural variants — to an average of about 152 per generation, but two-thirds of that increase is tandem-repeat length changes whose harmfulness is unmeasured.8
This article uses 70 point mutations per person per generation — the low end of the direct-sequencing measurements, and lower than the 100 to 175 that older creationist material quotes.
It is also lower than the number this argument's leading critic uses, which is worth saying because it runs against the article. Larry Moran calls the direct-sequencing method unreliable, puts the biochemical estimate at 130 and the phylogenetic estimate at 112 to 160, and has used 100 as his working figure since 2015.9 Every number below would be larger on his figure.
How harmful they are
Not very, individually — and that is the problem, not the reassurance.
The distribution of fitness effects has been measured in humans, flies, yeast and bacteria, and it is always the same shape: a long tail of barely-harmful mutations, with a thin tail of severe ones. Fitted to a gamma distribution, the shape parameter comes out near 0.2.10 11 12 In plain terms: most mutations that do anything at all do very little, and a few are disasters.
One caveat belongs here rather than in a footnote, because a critic will find it. Those gamma fits describe the deleterious side only, by construction — a beneficial fraction of zero is assumed, not measured. When Böndel and colleagues fitted a two-sided distribution to Chlamydomonas mutation-accumulation lines, they got a shape of 0.30 and a fitted positive-effect frequency of 0.84, while stating plainly that for most of their mutations "we do not know whether their effects are positive or negative."13 The one-sided fit is standard practice and it is also an assumption.
That is exactly the wrong shape. Selection is good at removing disasters. It is blind to the long tail.
Kimura made the point himself in 1979. He proposed the gamma distribution for this purpose and shaded in the region he called "effectively neutral" — mutations with selection coefficients between 0 and 1/(2N_e). His printed caption: "Frequency distribution of selection coefficients among mutants at different sites within a cistron (gene). The shaded area represents the fraction of effectively neutral mutations."14 His own summary: "even if the frequency of strictly neutral mutations (for which s' = 0) is zero in the present model, a large fraction of mutations can be effectively neutral if β is small."14
He also drew the consequence, on the paper's last page: "effectively neutral, but, in fact, very slightly deleterious mutants accumulate continuously in every species." He put the cost at about 10-7 of fitness per generation, called its threat to the species "a moot point," and said it "will easily be taken care of by adaptive gene substitutions that must occur from time to time (say once every few hundred generations)."14 So the founder of the neutral theory granted the mechanism in 1979. What he did not do was measure the beneficial supply that his answer needs, which is the question Argument 3 takes up.
Modern data put numbers on Kimura's shaded region for human proteins. Kim, Huber and Lohmueller fitted the distribution to large human samples in 2017 and found "34–37% of new mutations have |s| < 10-4," with about a quarter of new amino-acid changes below 10-5.12 The human drift barrier used in this article is about 4 × 10⁻⁵, so roughly a quarter to a third of new protein-changing mutations sit in the zone where selection cannot see them. That is the measured part. How much of the rest of the genome behaves the same way is the unmeasured part.
How much of the genome can be damaged
This is the biggest uncertainty in the whole subject, and it is worth being blunt about it: U scales linearly with the functional fraction of the genome. Double the functional fraction and you double the problem. This is why the junk-DNA fight matters so much to both sides.
Two qualifications on that scaling, both conceded to critics who raised them. It holds only for sequence-specific function, and the cleanest statement of that limit is in Joe Felsenstein's own population genetics textbook:
"If much of the DNA is simply 'spacer' DNA whose sequence is irrelevant, then there will be a far smaller mutational load. But notice that the sequence must be truly irrelevant, not just of unknown function. If the 'extra' DNA has regulatory or chromosome-pairing function requiring it to have a specific base sequence, then mutations in that sequence will still cause a mutational load, even if these loci are not producing polypeptide chains."15
That cuts both ways and both should be stated. DNA of unknown function still counts toward U if its sequence matters — which is the article's position. And DNA that has function without needing a specific sequence does not count, which Moran presses: "there are bulk DNA hypotheses that attribute non-sequence specific function to most of the genome and if they are correct the genetic load argument carries no weight."16 He thinks those hypotheses are unsupported, and so does this article — but it means the companion argument has to establish sequence-specific function, not function of any kind. And the scaling is an approximation, because functional classes differ in how much mutation they tolerate: an RNA secondary-structure element absorbs point mutations far better than a coding exon. That cuts both ways — such elements are more tolerant per site, and they also occupy more sites.
Comparative genomics — looking for sequence conserved across mammals — gives estimates from 4% to 15% depending on method and on how much correction is made for turnover:
| Method | Estimate | Source |
|---|---|---|
| 29 mammals, element-level | 4.2% of elements; ≥5.5% under purifying selection | Lindblad-Toh 201117 |
| Insertion/deletion method | 6.5%–10% | Meader 201018 |
| Turnover-corrected model | 8.2% (7.1–9.2%) | Rands 201419 |
| Zoonomia, 240 mammals | 10.7% element-level | Christmas 202320 |
| ENCODE leadership synthesis | 12–15%, plus 4–11% lineage-specific | Kellis 201421 |
| Strong selection only, within humans | 0.4%–0.7% | Dukler 202222 |
That last row is the honest floor and it deserves to be quoted rather than buried. A direct measurement inside 71,702 human genomes found only 0.4% to 0.7% of the genome under strong purifying selection, implying just 0.26 to 0.51 strongly deleterious mutations per generation.22 If genetic entropy were a claim about strongly harmful mutations, that number would sink it. It is not — it is a claim about the mutations below that threshold, which is precisely the region Dukler's method is designed not to detect.
Multiplying through, with 70 mutations per generation:
- Low. Peter Keightley's 2012 review puts the whole-genome deleterious rate at U ≈ 2.2.6 Lesecque and colleagues get 2.1.23
- Middle. Using published constraint directly: Rands's turnover-corrected 8.2% gives U ≈ 5.6. Zoonomia needs more care, because it publishes two numbers that measure different things. Its 10.7% is element-level — the share of the genome lying inside constrained elements, which counts every base in an element whether or not that base is itself constrained — and multiplying by it as though it were per base gives U ≈ 7.3, which overstates the case. Its single-base figure is 3.26%, which gives U ≈ 2.25, Keightley's number again.20 That one runs low for the opposite reason: a base counts only if it passes a conservative significance test (FDR below 5%), so weakly constrained bases are missed. This article therefore treats Zoonomia as a bracket, 2.25 as a floor and 7.3 as a ceiling, and does not use 7.3 as an estimate. The Masel group states its own working range as "U_d = 2-10."2
- High. Kellis's union of constraint estimates (16–26%) gives U ≈ 11 to 18. If the higher functional-DNA estimates are right — the case is made in the companion article Functional DNA is Evidence of Design — U is above 20.
Dan Graur, an evolutionary biologist and one of the fiercest critics of the ENCODE project, worked the same arithmetic in the opposite direction and reached the same place. His 2017 paper is titled "An upper limit on the functional fraction of the human genome," and its method is to ask how much function the mutation load can tolerate.24 He concluded that the functional fraction "cannot exceed 15%," and that if ENCODE's 80% figure were right, the required fertility would be absurd: 102 children per couple. His table carries a factor-of-two slip, and correcting it helps ENCODE. Table 1 computes the required fertility as e2U where eU belongs, because the diploid genome size he multiplies by already counts both copies of every site. A 2019 corrigendum added the missing "2" to his printed equation (3) so that it matched the table, announced that "The correct Table 1 is shown below," and reprinted Table 1 with every cell unchanged.25 Corrected, his ceiling at his own most permissive mutation rate is about 28% rather than 14–15%, and ENCODE's 80% needs about 14 children per couple rather than 102. That is still far beyond any human population, so the conclusion against ENCODE survives; the ceiling itself is roughly twice what he printed. Both sides of this argument agree on the arithmetic. They disagree about which premise gives.
Which of these numbers are measurements, and which are model outputs
Before going further, one distinction has to be made, because it changes how much weight each number can carry — and it is a distinction this article's sources do not always make for you.
Some of these quantities are measured. The mutation rate comes from sequencing parents and their children and counting what is new. That is a direct observation. It needs no assumption about how long humans have existed, how big the population was, or when anything diverged. Laboratory measurements of mutational effects are the same: a fitness assay in a flask is a measurement, whatever else is wrong with it.
Others are outputs of a fitted model, and the model contains a population history. Distributions of fitness effects inferred from human polymorphism data are obtained by fitting demography and selection jointly — you cannot get one without assuming the other. So is the effective population size of 10,000, which is a harmonic mean recovered from linkage disequilibrium under an assumed demographic history. So, in a different way, are constrained fractions from comparative genomics, which depend on a phylogeny and its divergence dates.
Johri, Pfeifer and Jensen address that dependence directly in "Developing an Evolutionary Baseline Model for Humans: Jointly Inferring Purifying Selection with Population History." They fit population history and purifying selection together, including the effect of selection on linked sites.26
And the coupling runs both ways, which is worse than a simple assumption. Soni, Pfeifer and Jensen showed in 2024 that background selection skews the site frequency spectrum, that the skew "may then be mis-inferred as population size changes using neutral demographic estimators, which may in turn result in a mis-inference of the DFE."27 Errors in the history and errors in the selection estimate feed each other. With realistic variation in mutation and recombination rates they found "variable mutation and recombination rates resulting in the inference of an excess of effectively neutral mutations," and in one case "DFE-alpha inferred a completely neutral DFE for population contraction scenarios."27
What follows for this article. There is a difference between adopting an opponent's timescale for the sake of argument — which is legitimate, and is what this article does throughout — and importing a number whose value was produced by assuming that timescale. The first is arguing on someone else's premises. The second is quietly inheriting them.
Of the four numbers this section is about, one is a measurement and three are model outputs. That does not make the three wrong. It does mean that anyone who rejects the demographic history also has to recompute them rather than borrow them, and that a reader who accepts the history should treat their error bars as wider than the published intervals suggest, because the published intervals condition on the model being right.
This article uses the mainstream values throughout and says so. Where a conclusion depends on one of the three rather than on the measurement, that dependency is now named at the point it is used.
This article uses U = 5 as its working figure — the middle of the mainstream range, derived from a mainstream constraint estimate. Every result below is also reported for U = 1.5 and U = 30 so you can see how much it matters.
And U = 5 sits above the ceiling the critics themselves name, which is a problem for them rather than for this article. The clearest statement of it is not in a blog post but in PLoS Genetics, in a paper defending junk DNA. Palazzo and Gregory set out the mechanism — "If the rate at which these mutations are generated is higher than the rate at which natural selection can weed them out, then the collective genomes of the organisms in the species will suffer a meltdown as the total number of deleterious alleles increases with each generation" — then give the ceiling, "approximately one deleterious mutation per generation," and then, in the same passage, the observed figure: "it has been estimated that humans sustain 2.1–10 deleterious mutations per generation."28
They resolve it the only way available to them, and they state the conclusion plainly: "By this line of reasoning, we would estimate that, at most, only 1% of the nucleotides in the genome are essential for viability in a strict sequence-specific way."28
Larry Moran makes the same argument less formally, putting the tolerable rate at "no more than 1 or 2 deleterious mutations per generation," and saying that at four per generation "that's an intolerable genetic load; it suggests that most of our genome is not a target (i.e. not functional)."29 29
Notice where that ceiling comes from. It is derived from the load formula — the same formula this article concedes below does not work, on the authority of Lesecque, Charlesworth and Galeota-Sprung. The two positions cannot both be held. If the load formula does not predict extinction, then "no more than 1 or 2" is not a real ceiling and the junk-DNA inference drawn from it does not follow. If it does predict extinction, then U = 5 is a prediction of extinction and the argument in this article is conservative. Anyone who takes the relative-fitness escape has to give up the ceiling with it.
This article takes the first horn: the load formula does not predict extinction, U = 5 is tolerable, and nothing in Argument 1 is a proof of anything. The argument that survives is the ratchet, which does not use the load formula at all.
The size of selection's blind spot
A mutation is invisible to natural selection when its effect is smaller than the random noise of who happens to survive. The threshold is sharp and it is one of the most solid results in population genetics: a mutation is effectively neutral when
2 × N_e × s < 1
where N_e is the effective population size and s is the fitness cost. For humans, N_e is estimated at about 10,000.2 So the blind spot covers every mutation costing less than about 0.005% of fitness.
Three qualifications, all of which cut against the argument this article is making, and all of which belong here rather than buried later.
It is not a cliff. "Effectively neutral" is a convenience, not a wall, and Tomoko Ohta — whose name the ratchet carries — says so herself: "the fixation probability is a continuous monotone function of Ns. Thus, when discussing molecular evolution by nearly neutral mutants, one has to consider all mutants around Ns ≈ 0."30 Right at the boundary, where N_e·s = 0.5, a beneficial mutation is still 2.31 times more likely to fix than a neutral one and 7.39 times more likely than its harmful mirror image. Selection is weak there; it is not absent. The figure below shows the transition running about a decade and a half wide, and the prose should be read against the figure, not against the inequality.
N_e = 10,000 is the critic's number, not ours. It is a harmonic mean over hundreds of thousands of years, inferred from linkage disequilibrium under a demographic model that assumes deep time. This article uses it anyway, on purpose: every quantity here is taken from mainstream measurement so the arithmetic can be checked by people who reject the conclusion. An argument that needed its own population sizes would not be worth making.
And going forward it is collapsing. For a mutation arising now, the relevant effective size is the present and future one, not the ancient harmonic mean. Joe Felsenstein — who worked out the overlapping-generations correction in 1971 — applies it here:
"The overlap of generations reduced the Ne to 1/3 of the census size. So maybe 2.7 billion. The result would be that the dynamics of any new mutations, from now on, would be nearly-neutral if the selection coefficients were less than +/- 0.0000000003."31
That is a blind spot more than five orders of magnitude narrower than the one this article works with, and on that number the ratchet very nearly stops. The objection is real and the reply is narrow: the load already fixed was fixed at the small ancient N_e, and fixation takes on the order of 4N_e generations, so a population explosion roughly ten generations old has not yet had time to change what fixes. The ratchet's rate as computed here is a statement about the past, not a forecast about the future. Anyone quoting these figures as a prediction about modern humanity is misusing them.
That said, the blind spot in the past sounds like nothing. It is not nothing, for a reason Kimura himself pointed out: mutations of small effect are more damaging in the long run than mutations of large effect, because the large ones get removed and the small ones do not. A mutation that kills you is a mutation that leaves no descendants. A mutation that costs you 0.002% is a mutation your species keeps forever.
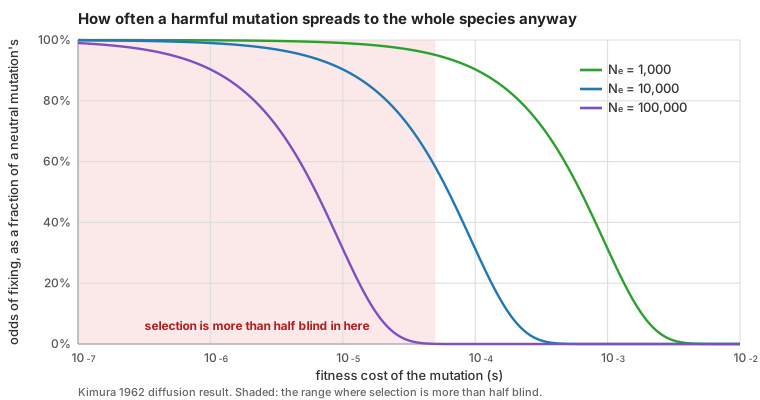
Kimura's 1962 diffusion result, drawn for a population of effective size 10,000. Below about s = 0.00001 a harmful mutation is as likely to spread through the entire species as a neutral one. Above about s = 0.0005 it essentially never does. The transition is only about one and a half orders of magnitude wide, and the whole argument lives inside it.
Argument 1: the load paradox, and why it is not a proof
The arithmetic
Haldane worked this out in 1937 and it has been rederived many times since. At mutation-selection equilibrium, each harmful mutation reduces the population's mean fitness by twice its mutation rate — regardless of how harmful it is. Multiply across all sites and mean fitness settles at
w̄ = e^(−U)
So the fraction of the population that must fail to reproduce, relative to a mutation-free individual, is 1 − e(−U).[crow-1997] 32 The numbers get ugly fast:
| U | mean fitness | load | offspring per female needed for 2 to survive |
|---|---|---|---|
| 1.0 | 0.368 | 63% | 5.4 |
| 2.2 | 0.111 | 89% | 18 |
| 3.0 | 0.050 | 95% | 40 |
| 6.0 | 0.0025 | 99.75% | 807 |
| 10 | 0.000045 | 99.995% | 44,000 |
Humans do not have 40 children, let alone 807. Hunter-gatherer women reach menarche around 16 and menopause around 47, with an inter-birth interval near 3 years, giving a ceiling of about 11 children.23
The clearest sign that this is not a creationist construction is that it is worked out, with these numbers, in the standard textbook written by one of the argument's sharpest critics. Felsenstein takes 20 million loci mutating at 10-7, gets a mean fitness of e-2 ≈ 0.15, and concludes: "Clearly an organism with as much DNA as we have would be in severe trouble. Yet in humans well over 98% of all newborns survive to adulthood in most industrial countries."15
He then lists three ways out, and it is worth noticing that the article's whole structure is a response to his list. The first is junk DNA, qualified as above. The second is that added function raises the fitness ceiling at the same time as it raises the load — which he objects to himself, because "it seems to predict that as more loci enter the genome the discrepancy between maximum possible fitness and average fitness increases. This is hard to reconcile with the high viability of humans in industrial countries."15 The third is interaction between mutants, so that one selective death removes many mutations — the truncation family of models, which he traces to Sved, Reed and Bodmer, King, and Milkman, all in 1967. That third answer gets its own section below.
This is why the load problem has its own literature, most of it written by people with no theological stake in it. Hermann Muller raised it in 1950.33 Kondrashov's 1995 paper is titled "Contamination of the genome by very slightly deleterious mutations: why have we not died 100 times over?"3 Crow's 1997 paper asks whether the mutation rate is a health risk and answers yes.1 Eyre-Walker and Keightley's 1999 Nature paper found the coding-sequence rate alone was "close to the upper limit tolerable."34 Nachman and Crowell in 2000: "each female would need to produce 40 offspring for 2 to survive."32
The strongest mainstream answers
There are two, and creationist sources usually engage only the first — which is the weaker of them, and the one the field has largely moved past.
(a) Truncation selection — the historical answer
Truncation selection works, and it is cheap. If everyone below a fitness threshold fails to reproduce, mutations are removed far more efficiently than if each is selected against independently. Crow and Kimura put the gain at 5 to 20 fold.35 Their point is not that truncation demands enormous fecundity — it is the reverse. Truncation is what lets a low-fecundity animal pay a load that multiplicative arithmetic says it cannot, and the example they work culls only 10% of the population, which is Haldane's own budget and which any vertebrate can afford.
That has to be granted plainly. It is the single best reason to think the load arithmetic overstates the problem.
The mainstream limit on it comes from the same population geneticist this article quotes on Mendel's Accountant. Asked directly why truncation is absent from standard models, and pointed at the Crow and Kimura paper above, Joe Felsenstein answered: "There are papers, such as that one, that try to work out the consequences of truncation selection. But generally we don't see such a mechanism at work in populations. That and it's harder to model mathematically."36 That is a stronger objection than Crow's, because Crow was calling strict truncation unrealistic while Felsenstein is talking about the mechanism as a class.
And Sanford's own group demonstrated it. In Biological Information: New Perspectives — a symposium volume Sanford co-edited — Brewer, Baumgardner and Sanford set Mendel's Accountant to ten new deleterious mutations per person per generation, six offspring per female, and strict truncation selection. Mutation count stopped rising at about 125 per individual by generation 100, and fitness settled at 0.94, flat for the rest of the run.37 Halve the truncation so that half the culling is luck, and it still holds. Sanford wrote the admission into the volume's own section introduction: the mechanism "actually can work, but only when mutation effects are relatively uniform, when there is truncation selection, and where there is sexual recombination."38
Two things follow, and neither is comfortable for the argument this article is making. The fecundity is charged and it is within reach — six births per woman with most not reproducing is inside the ceiling of about eleven that hunter-gatherer biology allows. And the equilibrium load is small: a 6% fitness deficit, not the 89% the multiplicative formula demands.
Their escape, and the problem with it. Their answer is that real mutations do not all have the same effect. Once effects span orders of magnitude, an individual's mutation count stops predicting its fitness, so selection on fitness stops removing counts. Re-run with a realistic spread of effects and every selection scheme declines to extinction.37
That figure has a problem its authors never mention. Rank the four selection schemes by how long the population survived and they come out backwards: full truncation dies first, at about generation 4,700, and ordinary fitness-proportional selection lasts longest, to about generation 8,100. More truncation made the population die sooner. That is the reverse of Crow and Kimura, the reverse of the same paper's own earlier figure, and the reverse of what the paper concludes from it. The likely cause is Mendel's additive fitness model: when mean fitness is allowed to fall toward zero while variance stays finite, fitness-proportional selection outruns truncation, because the response to selection scales with variance divided by the mean. Whatever the cause, the volume's central argument against truncation rests on a run in which truncation behaves anti-selectively, and nobody flagged it.
Three things bound it.
Price. The gain scales with how hard you cull. Culling 10% is nearly free; culling half means every breeding female must raise four offspring to adulthood, and culling 90% means twenty. Crow, who thought quasi-truncation realistic, still called strict truncation "totally unrealistic."1 And when Milkman introduced the threshold model in 1967, he justified its affordability by naming the organism it was affordable in: culling to the top 13.5% is "a practical procedure in Drosophila, whose females produce scores of eggs."39 He was not conceding a difficulty — he was arguing the mechanism works. But the reason he gives for its being practical is fecundity humans do not have.
Heritability. Truncation only removes mutations to the extent that the trait being truncated is heritable. How steeply the response falls with heritability depends on the yardstick: the share of the imposed selection that is passed on scales with h² itself (R/S = h²), while the move measured in additive-genetic standard deviations scales with its square root (R/σ_A = i·h). Measured heritability of total fitness in wild vertebrates is about 3%.40
And whether real selection looks like this at all. The Masel group tested Haldane's assumption directly in Genetics in 2025 and found the proportion of deaths that are genuinely selective can far exceed his 10% ceiling — between 8.5% and 95% depending on conditions.41 That is a real result and it cuts against the load argument. Their data are from Arabidopsis, an annual selfer with enormous fecundity, and they flag less-fecund species as future work. Humans are the paradigm less-fecund species.
Drift Lab reports the bill rather than assuming it away: run truncation selection and it computes the fecundity that regime demands and whether the species you specified can pay it.
But this is not where the argument is anymore, and creationist sources that stop here are fighting a dead war. The Masel lab's own summary calls synergistic epistasis "one historical solution to the mutation load paradox, often modeled in extreme forms such as truncation selection," and then closes it: "Since then, data has come out showing that the mean effects of two deleterious mutations are extraordinarily close to multiplicative."42 Truncation was answered by the data, not by argument. The live answer is different.
(b) Polygenic stabilizing selection — the live answer
Zach Hancock, a population geneticist who co-authored the formal rebuttal to Basener and Sanford's 2018 model, was asked directly what his strongest argument against genetic entropy is. His answer was not truncation:
"The argument I presented during the debate is what I consider the strongest argument against GE — that is, that most complex traits are highly polygenic, and thus selection is exceptionally effective despite being weak on each individual allele (e.g., Barton 2022)."43
The mechanism is the one Barton states in the passage quoted at the top of this article. Under the infinitesimal model, a trait is the sum of thousands of alleles of tiny individual effect. Selection acts on the sum. It can hold the sum at its optimum with enormous precision even though no single allele is under selection strong enough to beat drift. And because many different combinations of alleles produce the same sum, a mutation that pushes the trait one way can be offset by anything that pushes it back — which is exactly what Barton means by "any change that degrades fitness can be compensated."
Charlesworth put numbers on it in 2013, in the paper whose title asks the load question outright. With human parameters — Sa² = 5 × 10⁻⁷, N_e = 20,000, π = 0.001 — his stabilizing-selection load comes to L*stab = 0.05.44 Five percent, not eighty-nine. His verdict on that model is unambiguous: "the load can be small to moderate, even with tens of millions of sites subject to selection of the strength estimated from population genetic data. There is thus no threat to the survival of the population."44
Read the next sentence of that paragraph, though, because it is the whole ballgame:
"However, the relative importance of stabilizing versus purifying selection for synonymous and noncoding sites is currently unknown, so the question of the load under weak purifying selection also needs consideration."44
Charlesworth's escape is conditional on which kind of selection those sites are actually under, and he says nobody knows. So he works the other branch — and this is the part of the paper that never gets quoted:
"in contrast to the situation with stabilizing selection, if there is genome-wide purifying selection of the type described by equation (4) on the scale suggested by the recent findings mentioned earlier, an extremely high level of genetic load is inevitable, in agreement with Kondrashov (1995a)."44
His numbers on that branch are not small. For Drosophila, with 14 million synonymous codons under purifying selection, the load is 0.83 with completely synergistic selection and 0.97 with multiplicative fitnesses; use the larger noncoding count and they become 0.998 and 1.00. And then: "The situation is even worse in species with effective population sizes that are 10-fold or more smaller, and that have many more noncoding sites under selection, such as humans."44
So the paper routinely cited as the answer to the load paradox says the load is near-total if the sites are under purifying selection, that this is worse in humans than in flies, that it agrees with Kondrashov, and that which model applies is unknown. Its resolution is to reinterpret the sites as being under stabilizing selection instead — which is a hypothesis about what those sites are doing, not a measurement of it.
That is the same open question this article keeps arriving at from other directions, and it is now stated by the strongest source on the other side.
Three things have to be granted. Trait-level selection is real and powerful; the entire history of plant and animal breeding is the demonstration. Complex traits genuinely are polygenic, and the omnigenic evidence for it has only gotten stronger. And selection on a sum genuinely is far more effective than selection on any of its terms — this is not a trick, it is the reason quantitative genetics works.
A note on a quotation you will meet. Charlesworth is often quoted as writing that "the mean fitness of the population relative to the fitness of a hypothetical optimal genotype that has a very low chance of being present in the population is essentially irrelevant." He does write that, and this article accepts it — it is the lag-load point conceded below. But the sentence immediately after is usually dropped, and it matters: "However, we need to be assured that the level of variation in fitness is not so large as to be implausible, but is large enough to be compatible with a selection coefficient of the order of 1/(4N_e)."44 He is replacing one test with another, not abolishing the problem.
And here is the reply. Read Barton's sentence again. Not repaired — compensated.
The infinitesimal model is a model of trait optimisation, and it delivers exactly what it promises: the trait mean stays at the optimum. It says nothing whatever about whether the alleles holding it there are the ones that were there before. In fact it says the opposite, and says it as a feature: the whole reason the model tolerates drift at individual sites is that the specific alleles do not matter, only the sum. Sequences turn over underneath a stable phenotype. Hartl and Taubes showed the same thing formally in 1996: compensatory evolution "results in no change or permanent improvement in enzymatic function."45
So the polygenic answer is not a refutation of the accounting argument. It is the accounting argument, stated by the other side, and counted as good news. Fitness is maintained; sequence identity is not. Whether that difference matters is the whole of Argument 3 below, and it is not settled by pointing at the load number.
Where the polygenic answer is strong and where it is weak. It is strongest for traits that really are sums — height, yield, risk scores, anything where a thousand small contributions add up and many combinations reach the same total. It is weakest for the parts of the genome that are not doing arithmetic at all. A splice acceptor site is not a polygenic trait. A transcription factor binding motif either matches or it does not. A protein's active site is a specific arrangement of specific residues. For those, there is no compensating allele elsewhere that restores the sum, because there is no sum. The infinitesimal model is a good description of the additive, quantitative fraction of the genome and a poor description of the switch-like fraction, and the argument here has always been about the second.
That is a real division of the genome, and neither side has measured how it splits. It is the sharpest open question in this dispute and it is stated as such in what this does and does not show.
And the objection has a mainstream answer that does not come from this side of the argument at all. Michael Lynch, whose drift-barrier work Barton was criticising in the passage quoted above, has taken the argument onto Barton's own ground — stabilizing selection on quantitative traits — and reached the opposite conclusion. From his 2025 paper with Menor in Genetics:
"Although multigenic traits are often assumed to be under some form of stabilizing selection, numerous aspects of the population-genetic environment can cause mean phenotypes to deviate from presumed optima, often in ways that effectively transform the fitness landscape to one of directional selection."46
And on whether the barrier stops at the molecular level:
"Drift barriers, which are universal properties of all finite populations (i.e. all of biology), denote the limits to which mean phenotypes are expected to wander over evolutionary time."46
So the question of whether a polygenic trait actually sits at its optimum in a finite population is live inside mainstream population genetics, argued by the two people best placed to argue it, and it has not been settled in Barton's favour. This article does not need it settled in the other direction either. It needs the reader to know that "selection on polygenic traits handles it" is a position with an opponent, not a closed case.
One more thing should be said, and it comes from Charlesworth rather than from anyone arguing this article's side. In a separate paper the same year, he worked out whether the polygenic answer can be told apart from the ordinary one using sequence data, and found that the frequency spectra produced by these models can be difficult to distinguish:
"These results mean that studies utilizing data such as the frequency spectra of DNA sequence variants may find it virtually impossible to distinguish stabilizing from purifying selection."47
So the strongest objection to this article is a model that fits the data, not a measurement that decides between models. That is not a criticism of it — the same is true of the position argued here. It is a reason to hold both loosely, and a second place where the dispute reduces to a measurement nobody has made.
Why it does not prove the genome is decaying
Because the comparison is to a genotype that does not exist.
Every one of those calculations measures the population against a hypothetical human with zero harmful mutations. In a population where everybody carries thousands, that individual has never been born and never will be. What actually determines who reproduces is how you compare to the people around you.
Lesecque, Keightley and Eyre-Walker made this formal in 2012 in a paper called "A resolution of the mutation load paradox in humans." Under a relative-fitness model, they showed, "a species could tolerate 10's or even 100's of new deleterious mutations per genome each generation."23 Brian Charlesworth reached the same destination by a different road the following year, in the paper quoted above: his second resolution is soft selection, in which "individuals compete for a limiting resource whose abundance determines the absolute fitness of the population," and weak purifying selection across many sites "produces only a small variance in fitness among individuals within the population, due to the fact that most sites are fixed rather than polymorphic."44 Galeota-Sprung, Sniegowski and Ewens took the same objection to Graur's functional-fraction bound in 2020 and concluded that "an argument from mutational load does not appear to be particularly limiting on f" -- f being the functional fraction of the genome.48
This objection is correct, and any honest presentation of genetic entropy has to concede it. The load formula assumes hard selection against an absolute standard. Real selection is largely soft: a fixed number of slots, filled by whoever competes best on the day. Under soft selection nobody has to have 807 children, because nobody is being measured against a perfect genome.
A second concession: the load's demographic cost depends on when you die
There is a further step, and it is worth taking on its own because it does not depend on relative fitness at all. Even granting a load in absolute terms, the demographic price depends on how much of a lifetime's resources the individuals who die have already consumed.
Agrawal and Whitlock worked this out in 2012. If a fraction L of the population dies of deleterious alleles before adulthood, and those individuals consume only a fraction β of what a healthy adult consumes, the equilibrium population size is
N̂ = bI(1 − L) / [d(1 − L(1 − β))]
Their conclusion: "if the selective deaths occur early in life, such that β is small, the demographic consequences of load can be greatly reduced, at least at the adult stage."49 A miscarried embryo costs the population almost nothing. So the "807 children" column is not what the load implies unless selection is acting on grown offspring.
This is a good argument, and it has a limit that is easy to miss: it is strongly dependent on U. Run their formula across the same range as the table above.
| U | load | β = 0.5 | β = 0.1 | β = 0.01 | β = 0.001 |
|---|---|---|---|---|---|
| 1.0 | 63% | 54% | 85% | 98% | 99.8% |
| 2.2 | 89% | 20% | 56% | 93% | 99.2% |
| 4.0 | 98.2% | 3.6% | 16% | 65% | 95% |
| 6.0 | 99.75% | 0.5% | 2.4% | 20% | 71% |
| 10 | 99.995% | 0.009% | 0.05% | 0.5% | 4.3% |
Equilibrium adult population as a percentage of the unloaded population, from Agrawal and Whitlock's expression, at each mutation rate. β is the fraction of an adult's lifetime resource consumption used up by an individual who dies a selective death.
At the low end of the U bracket the escape is complete: a load of 89% costs 7% of carrying capacity if the dying are embryos. At the middle of the bracket it is not. At U = 6 with β = 0.01, the population sits at a fifth of its unloaded size; to keep it above 70%, β has to fall to about 0.001 — every selective death has to cost one-thousandth of what raising an adult costs.
And humans are the worst case for small β. Human reproduction is exceptionally expensive per offspring: nine months of gestation, single births, and fifteen or more years to maturity. A human who dies selectively at fifteen has consumed a large fraction of an adult's lifetime resources. Only very early embryo loss is cheap. β is unmeasured in humans, on both sides of this argument, and neither side should pretend otherwise — but the direction of the human life history pushes it up, not down.
And their supplement narrows the escape further, in a way the headline formula hides. Which vital rate the load falls on decides everything: "Load on birth rate or survival causes a nearly proportional decline in equilibrium population density, while load on acquisition ability tends to have little effect on density."49 The cheap case is load on how well an organism gathers resources. Deleterious mutations in humans do not mostly reduce foraging efficiency — they reduce survival and fertility, which is the expensive case. Their own summary is that "the effects of load depend on the details of the interaction within and among species," and those details are not favourable here.
Agrawal and Whitlock say as much themselves, and it is the reason this concession is bounded rather than total: "In fact, ecological processes are unlikely to completely mask the effects of genetic load."49
Felsenstein made the same point earlier and added the part that matters most for the species that are actually at risk. Granting that culling 1000 offspring to 500 may barely move the adult population under density dependence, he writes:
"It would be a mistake to conclude from this that the mutational load has no effect whatsoever on population dynamics. The reproductive excess acts as a buffer allowing the population to survive various misfortunes, and a reduction of the size of this buffer, even if it has little effect on average population size, may make the population more vulnerable to extinction in time of crisis."15
That is the honest shape of the load concession. The load does not kill a large stable population. It spends the margin that population has for surviving a bad century, which is exactly the quantity that decides the small-population cases below.
There is a real reply, and it is not a dodge. Michael Lynch put it in 2016: relative fitness explains why nobody is dying at 89% per generation, but it does not make the deterioration unreal. "Physical defects involving cancer, metabolic disease, and psychiatric disorders have very real costs regardless of the average population state."50 Sickness measured against your neighbours is still sickness.
There is a second reply, and it comes from the lab whose simulation this article leans on most. The Masel group's own research page states the problem without softening it:
"Most work on mutation load periodically renormalizes relative fitness to deal with the fact that fitness keeps declining no matter what, or else treats only a subset of the genome. Either way, this is dodging the problem, not tackling its fundamentals."42
The same page gives their answer, and it should be quoted alongside rather than left out: "We think the answer is a 'ratchet' in which many small-effect deleterious fixations are counterbalanced by a much smaller number of large-effect beneficial fixations."42 They add a sentence that matters for what follows: "This has some similarities with 'drift barrier theory', but emphasizes that the cause of the ratchet is not small population size, but a high genome-wide deleterious mutation rate."42 That is Argument 2's claim exactly — the ratchet runs on U, not on N_e being small.
So they are not saying the load paradox is unsolved and walking away. They are saying the usual way of making it go away is bookkeeping, and offering the ratchet as the real answer. That is this article's framing — load fails, ratchet holds, the accounting is what is left to argue about — arrived at independently by people who reach the opposite conclusion from it.
And the same page corrects this article's own arithmetic, which is worth stating rather than hiding. The load in the table above is what population genetics calls the lag load: the gap between the population's mean fitness and a theoretical optimum nobody ever reaches. Masel's page names that as a mistake:
"The 'lag load' is the difference between population mean fitness and some theoretical optimal fitness that is never obtained; inappropriate use of the lag load is one contributor to confusion (panel B). The more appropriate load is the difference between the population mean fitness and the highest fitness individual actually found in a population — this quantity was rediscovered and named the 'lead' (Desai & Fisher 2007)."42
The lead is the right quantity, and it is small where the lag load is enormous, because the best individual actually alive is not mutation-free either. This is the same objection as the relative-fitness one, stated more precisely, and it is a second reason the "807 children" row should not be read as a prediction about anybody. It is also what Galeota-Sprung and colleagues compute, so two of the sources this article leans on are making one coherent point rather than two scattered ones.
None of this touches Argument 2, because fixations are counted, not inferred from a load formula.
But that is an argument about consequences, not a proof of decline. The proof has to come from somewhere else.
Argument 2: the ratchet, and why it holds
The mechanism
Selection acts on differences. Once every member of a species carries the same mutation, there is no longer any difference to act on. The mutation is fixed, and no amount of future selection can remove it, because there is nothing left to compare it against. That is not a controversial claim; it is the definition of fixation.
The question is how often a harmful mutation gets all the way to fixation. Kimura answered it in 1962. For a new mutation starting in a single copy out of 2N, with a fitness cost s:
P(fixation) = (e^(2·N_e·s/2N) − 1) / (e^(2·N_e·s) − 1)
Below the blind spot this collapses to 1/(2N) — the same odds a completely neutral mutation has. And Kimura's other famous result is that neutral mutations fix at exactly the rate they arise, no matter how big the population is.
Put those together and the conclusion is unavoidable. If a fraction of new harmful mutations fall below the blind spot, that fraction fixes permanently at close to the full mutation rate, forever.
The numbers
Working the integral over a measured distribution of fitness effects, for a human-sized population:
| U | harmful mutations fixed per generation | over 300,000 generations (~6 million years) |
|---|---|---|
| 1.5 | 0.33 | 99,800 |
| 5 | 1.11 | 333,000 |
| 10 | 2.22 | 666,000 |
| 30 | 6.66 | 2,000,000 |
Effective population size 10,000; gamma-distributed effects with shape 0.2 and mean 0.001; free recombination. Computed from Kimura's fixation probability, and confirmed by simulation — see below.
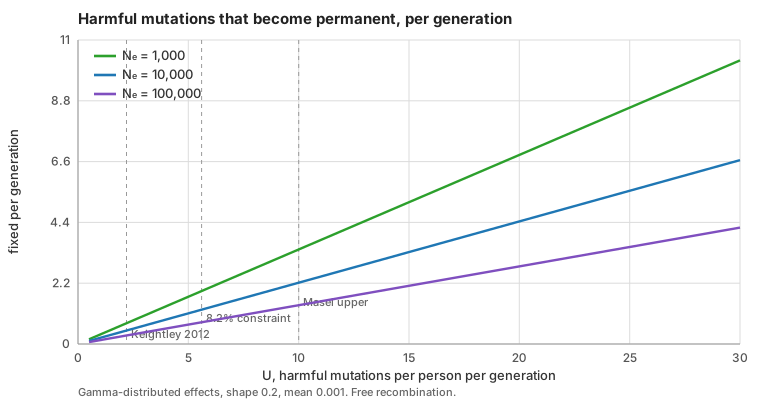
The relationship is linear in U, which is why the functional fraction of the genome matters so much. A larger population helps, but not nearly enough: raising the effective size a hundredfold, from 1,000 to 100,000, only cuts the rate by about 60%.
At the working figure of U = 5, roughly one harmful mutation becomes permanent in every human being, every generation. Over the six million years since the human and chimpanzee lineages are supposed to have split, that is about a third of a million permanent losses.
Checking the arithmetic against the people who disagree
The strongest available check is not a creationist source. It is the Masel lab's 2025 paper, which ran a far more elaborate simulation — real chromosomes, linkage blocks, background selection, beneficial mutations, 200,000 generations — and reported its fixation counts.
Feeding their published parameters into the calculation above gives:
| deleterious fixations in 200,000 generations | |
|---|---|
| Matheson, Hernández, Bertram & Masel 2025, by simulation | 56,255 |
| This article's calculation, from Kimura's equation, on the paper's stated parameters | 63,212 to 71,056 |
Their parameters: effective population size ~7,500, U_d = 2, and a gamma distribution of fitness effects after Kim et al. 2017 with shape 0.169 and mean heterozygous effect 0.009.2 The two figures are the two ways of feeding that heterozygous effect into Kimura's equation: doubled to a homozygous effect (63,212) or taken as it stands (71,056). An earlier version of this table printed 60,780 and called the agreement eight percent. That figure used a gamma shape of 0.2 and treated 0.009 as a homozygous effect; the paper states neither, and the two slips happened to cancel.
The two routes agree to within 12% to 26%, depending on how the paper's own effect sizes are read — one a C program written by a mainstream evolutionary genetics lab, the other a diffusion equation from 1962. The gap runs in the expected direction: the diffusion equation treats every site as evolving on its own, while real linkage and background selection in the simulation lower the fixation rate, so the simple calculation should come out higher, and it does. Whatever else is in dispute, the rate of permanent genetic damage is agreed to within about a quarter.
Run it yourself
Drift Lab simulates this in your browser. The default run is a diploid population with the parameters above. Three things about it are worth knowing before you trust anything it says.
It is deliberately generous to natural selection. Every site is inherited independently of every other, so no good gene is dragged down by a broken neighbour — no Hill-Robertson interference, no hitchhiking, no Muller's ratchet in the classical sense. An individual's chance of reproducing is exactly its genome, with no luck involved. The population can never shrink, so there is no death spiral. All three of those assumptions make selection more effective than it can possibly be in a real organism.
It grades itself against results that predate computers. The Verify tab runs the simulation against Kimura's 1968 neutral substitution rate, Watterson's 1975 formula for the number of segregating sites, Kimura's 1962 fixation probability, and Haldane's 1937 equilibrium. All four pass:
PASS  Kimura 1968: neutral substitution rate = mutation rate
      measured 0.4976, expected 0.5000
PASS  Watterson 1975: number of segregating sites
      measured 3417, expected 3395
PASS  Haldane 1937: fitness at mutation-selection balance = e^-U
      measured 0.3693, expected 0.3679
PASS  Kimura 1962: probability a harmful mutation fixes anyway
      measured 0.0005820, expected 0.0005823
It reproduces the stable case too. Set every mutation to cost 1% and the decline stops dead: mean fitness parks at e^(−U) and stays there for as long as you care to run it, with zero fixations. Mutation-selection balance is real, and the simulator finds it. That matters, because it means the decline in the other runs is not an artefact of the code. It is the biology of the parameters.
And a caveat that applies to every simulation in this dispute, including this one. A simulation's output is a consequence of its assumptions, not independent evidence for them. Drift Lab cannot tell you whether U is 2 or 7, what the real distribution of fitness effects looks like below the drift barrier, or how much of the genome is functional. It can only tell you what follows if you assume particular answers. That is worth stating because simulation output is routinely presented as empirical in this argument — by both sides — and it is not. What the self-tests above establish is narrower and more useful: that the code correctly implements the population genetics, so any disagreement is about the parameters rather than the arithmetic. The parameters are where the argument actually is.
Where the ratchet ends
The most substantial objection to all of this comes from Dan Stern Cardinale and others, and it is correct as far as it goes: there is no infinite runaway. Sites are finite. Once a site has lost its letter, further mutations there do nothing more, and mutation runs both ways — a broken site can mutate back. So an equilibrium exists, and the genome cannot decay forever.
True. The two questions this leaves open are where the equilibrium sits and how long it takes to arrive, and both have answers.
Where. In the regime real genomes are in, a site spends most of its time fixed one way or the other, and the ratio between the two is set by how much more likely a beneficial fixation is than a harmful one. With three wrong letters for every right one:
fraction of sites sitting wrong at equilibrium = 3 / (3 + e^(2·N_e·s))
At an effective population size of 10,000:
| fitness cost of losing the site | 2·N_e·s | fraction wrong at equilibrium |
|---|---|---|
| 0.001% | 0.2 | 71% |
| 0.005% | 1 | 52% |
| 0.01% | 2 | 29% |
| 0.02% | 4 | 5.2% |
| 0.05% | 10 | 0.01% |
Verified three ways: by numerical integration of Wright's stationary distribution, by a direct Wright-Fisher simulation in a rescaled regime, and by the Genome kernel in Drift Lab. All three agree to within a percent.
A third force this formula leaves out, and why it does not change the answer. Mutation and selection are not the only things that decide which letter a site ends up with. GC-biased gene conversion — gBGC — is a repair bias during recombination that favours G and C over A and T, and it acts regardless of fitness. It is not a mutation-rate effect; it behaves like a selection coefficient, which means it operates in exactly the near-neutral zone this whole argument is about. A critic is right to ask whether it breaks the equilibrium above.
Worked through, it does not, and the reason is a coincidence worth stating. gBGC pushes sites whose required letter is G or C toward the right answer and sites whose required letter is A or T toward the wrong one, so it splits functional sites into two groups shifted in opposite directions. Whether that raises or lowers the average fraction sitting wrong depends on the curvature of the equilibrium curve — and that curve is a logistic centred at 2·N_e·s = ln 3 ≈ 1.10, which is precisely the point at which it is 50% wrong. At the inflection the two shifts cancel exactly. The article's headline claim about weakly-constrained sites sits on the one point in the whole range where gBGC has no net effect at all.
Away from that point it has some effect, but not much, because gBGC is weak. Glémin and colleagues measured the population-scaled coefficient B = 4N_e b across three human populations and got 0.27 to 0.43 — "in the nearly neutral area" — with B above 5 in only 1–2% of the genome, near recombination hotspots.51 At the genome-average value, the largest shift anywhere in the table above is under one percentage point, whichever way the sites are split between G/C-requiring and A/T-requiring.51 In the 1–2% of the genome that sits in hotspots the effect is real and large, and this article's equilibrium numbers should not be applied there.
The bigger simplification is elsewhere, and it should be admitted. The "3" in the formula assumes the three wrong letters are reached at equal rates. Real mutation is nothing like uniform — transitions outnumber transversions roughly two to one, and CpG sites deaminate about an order of magnitude faster than anything else. That approximation distorts the equilibrium more than gBGC does, and correcting it properly would require a full 4×4 substitution model rather than a two-state one. Drift Lab does not model nucleotides at all: it stores one bit per site, working or broken, and the four-letter alphabet enters only as a 3:1 ratio of forward to back mutation. That is a real limit on both the formula and the simulator, and it is the honest place to point a critic.
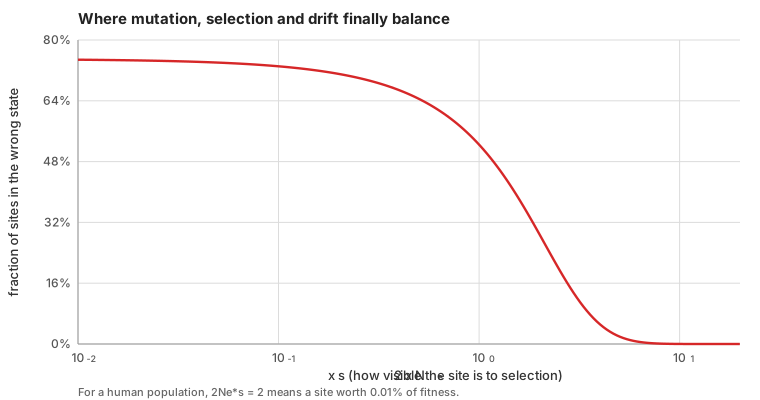
The flat left-hand end is the neutral answer: three of the four possible letters are wrong, so a site selection cannot see is wrong 75% of the time. A site has to be worth more than about 0.01% of an organism's fitness before selection holds it in place.
So the equilibrium the objection points to is one in which every weakly-constrained functional site is wrong about half the time. Genes do not work at that level of corruption. The equilibrium is not a floor the genome rests on; it is the state of a genome that has stopped being a genome.
And it has now been measured in real genomes rather than argued about. Latrille and colleagues analysed 28 mammalian populations across six genera, including humans, and reached a conclusion that supports this article's Argument 2 and complicates its Argument 3 in the same sentence:
"Our work confirms that deleterious substitutions are accumulating in mammals and are being reverted, generating a balance in which genomes are damaged and restored simultaneously at different loci."52
The first half is the ratchet, observed in sequence data rather than simulated. The second half is a bigger repair flux than this article's treatment of back mutation allows for: they estimate that beneficial non-adaptive mutations — reversions restoring a previously lost state — make up 15% to 45% of all beneficial mutations in 24 of their 28 populations.52
That number deserves to be sat with rather than explained away. If a third of beneficial mutations are repairs rather than innovations, the accounting question changes shape: the genome is not only being compensated, it is partly being fixed. What it does not do is make the ledger balance by itself, because a reversion restores a site that was already broken — it does not build a new one, and the sites available to revert are exactly the ones the ratchet has already damaged. Reversion is the mechanism that produces an equilibrium, which this section is about, not a mechanism that produces gain.
How long. The waiting time for a site to be destroyed is about 1/μ generations — around 80 million generations at the human per-site mutation rate. Nothing living is anywhere near equilibrium. Every real genome is in the transient, and the transient is a straight line downward.
That is the honest answer to the equilibrium objection: technically right, practically irrelevant, and its own implications are worse than the problem it was raised against.
But there is a second brake, and it is a real one
The mutation-selection equilibrium above is not the only thing that can stop the decline. There is a feedback loop, it is measured, and it is the strongest objection in this section.
As a population's fitness falls, the fraction of mutations that can improve it rises. This is a consequence of Fisher's geometric model — a population far from its optimum has many ways to get closer — and it has now been measured about as sharply as anyone could ask.
Ardell, Martsul, Johnson and Kryazhimskiy measured the fitness effects of about a hundred insertion mutations across 42 yeast strains in six environments, and published the result in Science in 2024. Their finding is that the scaling of mutational effect with background fitness is nearly the same in every environment, and it has a consequence they state plainly: "the proportion of beneficial mutations should increase with the decreasing fitness of the background strain, reaching up to 100% in the lowest-fitness genotypes."53
Their raw counts make the same point from the other end. Of the mutations they tested, "94% (88/94) of our mutations are beneficial in at least one strain and condition, and, of those, 96% (85/88) are also deleterious in at least one strain and condition."53 Almost every mutation is both, depending on where it lands.
That is not an isolated result. Couce and colleagues found the beneficial fraction in E. coli contracting from 6.8% in the ancestor to 3.2% after 15,000 generations of adaptation.54 Silander and colleagues found the reverse in bacteriophage: high-fitness lines under drift declined, low-fitness lines improved, and both converged on the same middle.55
Run that forward and the ratchet is self-limiting. Decline raises the beneficial supply; the raised supply slows the decline; the system settles at a fitness where the two rates match. That is not a terminal process, and this article should not pretend otherwise.
The reply is the one this whole argument turns on, and it is not a dodge: the feedback bounds fitness, not sequence.
Look closely at what Ardell's result says a "beneficial" mutation is. The environment, in their model, "tunes one global parameter, the background fitness at which most mutations switch sign."53 A mutation does not become beneficial because it built something. It becomes beneficial because the background got worse — the same change that was harmful in a healthy genome is an improvement in a degraded one. That is regression toward a mean, and the mean it regresses toward is falling.
The compensating mutations are somewhere else. Nothing in the mechanism sends a repair to the site that broke — Hartl and Taubes showed formally that compensatory evolution "results in no change or permanent improvement in enzymatic function."45 So the equilibrium the feedback produces is one where fitness has stopped falling and specific sequences are still turning over underneath it. That is the same structure as the polygenic answer above, reached from a different direction, and the same reply applies.
And one feedback runs the other way
Both brakes above slow the decline. There is one measured mechanism that speeds it up, and it is the only one in this subject.
Sharp and Agrawal found in PNAS in 2012 that the mutation rate in Drosophila is not a constant of the species but depends on the genetic quality of the individual. Flies carrying deleterious alleles mutated faster than unimpaired controls, on chromosomes unlinked to the damage. Their conclusion is the one sentence in this literature that describes an accelerator:
"individuals with low-quality genotypes will produce offspring of even lower genetic quality, in a mutational positive feedback loop."56
The size is not trivial. For genotypes showing a 10% reduction in body mass, they report roughly a 77% increase in the deleterious mutation rate and about a 104% increase in the rate of mutational decline.56
What it does and does not establish. It is one species, and the mechanism is plausible but not pinned down — a damaged genome may invest less in DNA repair, or suffer more oxidative damage. It has not been measured in a mammal. But it means the standard treatment, in which U is a fixed parameter of the species, is an approximation in the direction that flatters the population: a genome that has already degraded mutates faster than the one used to compute its future. Every projection in this article, including its own, holds U constant and is therefore conservative if this result generalises.
Which means the honest version of this article's claim is narrower than the popular version. Genetic entropy as "fitness declines to extinction" has a real mechanism working against it and probably does not happen in large populations. Genetic entropy as "specific functional sequence is destroyed faster than it is built" survives the feedback, because the feedback does not act on that quantity at all. Everything below is about the second claim.
Three results that point the other way
Before going further, three mainstream findings belong on the table, because they are the best evidence against everything above and a reader will find them eventually.
Mutation accumulation lines sometimes get better. Bao, Melde and Sharp catalogue experiments in Arabidopsis, C. elegans, Daphnia, yeast and Chlamydomonas that show no fitness decline at all, and report Shaw and colleagues' conclusion that about half the mutations in their study were beneficial.57
A two-sided fit puts most mutations on the positive side. Böndel's Chlamydomonas analysis fitted a positive-effect frequency of 0.84.13 The same group went further in 2022, tracking 254 individual spontaneous mutations by how their frequencies actually moved, and reported that "as many mutations were observed to increase as decrease in frequency" — a positive-effect proportion of 0.50, with a confidence interval of 0.43 to 0.58.58 Peter Keightley is senior author on both. This is the most direct measurement in the list and it says the distribution is symmetric.
Beneficial mutations are commoner than the argument wants. Joseph and Hall titled their yeast paper "more beneficial than expected" and measured 5.75%.59 Firnberg's million-variant scan of β-lactamase found 7.0%.60 Goyal and colleagues calculate that roughly 2% beneficial is enough to hold the line indefinitely against Muller's ratchet.61 Every measured fraction in that list clears the bar.
There are three legitimate replies and all come from mainstream sources.
The first is that the high beneficial fractions are probably an artefact, and this is now the mainstream position. Crombie and colleagues broke the linkage between mutations in C. elegans mutation-accumulation lines by advanced intercrossing — the confound that makes every line's mutations inseparable — and concluded: "unless it can be shown otherwise, estimates of the distribution of fitness effect that infer a substantial fraction of mutations with positive effects are likely confounded by linkage disequilibrium."62 Their verdict on the older picture is blunt: "the conventional wisdom — most mutations have effects near 0, a handful of mutations have effects that are substantially negative, and mutations with positive effects are very rare — is likely correct."62
Their abstract reports roughly 40% positive effects in the full dataset before the correction, so a reader who stops partway gets the paper backwards — but its closing sentence states the conclusion plainly, and quoting the abstract in full is safe.
Second, mutation accumulation experiments are biased upward regardless, because selection cannot be switched off entirely during colony expansion.63 And every one of those systems is assayed in a laboratory environment it is not adapted to — which is precisely the condition under which Fisher's model predicts an inflated beneficial fraction. A population far from its optimum has plenty of ways to improve. A well-adapted one does not, which is what Couce and Silander measured.
That second reply has a price, and it should be paid out loud rather than left for a critic to collect: it is the same mechanism as the feedback brake described above, pointed the other way. If being far from the optimum inflates the beneficial fraction in a laboratory flask, then it also inflates it in a genome that has been decaying for ten thousand generations. This article cannot use the mechanism to discount inconvenient measurements and then ignore it when it bounds the decline. It does not get to have it only once, and the section above concedes it.
Two further concessions belong here, and both cost this article something.
Böndel's 2022 symmetry result has an answer, and it is the one their own authors give: the mean absolute effect they measure is "just over 2%," which is five hundred times the human drift barrier, and they note that loss-of-function mutations in genes not needed in laboratory culture may be advantageous there.58 So the result is real and it does not reach the zone in dispute. But "it does not reach the zone" is a reply this article has now used against several measurements, and a reader is entitled to notice that the zone in dispute is one where nobody has data at all.
And Crombie's linkage correction, quoted above in this article's favour, carries a second finding that runs against it: "almost all mutations have effects that are very close to 0, and … the decline in fitness with MA is the result of a small number of mutations with large negative effects — perhaps only one."62 If the observed decline in mutation-accumulation lines is driven by a handful of large-effect hits, then those lines are a poor model for the genome-wide drizzle of near-neutral damage this article is actually about. They cannot be used as evidence for it.
That is the honest state of it: the objection is strong, the replies are real, and the question is not closed.
Argument 3: the accounting
Here is where the disagreement actually lives, and it will not be settled by arithmetic alone.
Over six million years, at U = 5, the human lineage fixes about 333,000 harmful mutations. What does it fix in the other direction?
Estimates of adaptive substitution in the human lineage are low. Larry Moran, a biochemist at the University of Toronto and a prominent critic of intelligent design, was asked in 2014 how many of the roughly 46 million mutations separating humans and chimpanzees were adaptive. His answer, quoted in full because the qualification matters: "We don't know how many of those were beneficial (adaptive) leading to ways in which modern chimps are better adapted than the common ancestor. (Same for humans.) My guess would be only a few thousand in each lineage."64 It is a guess, he says so, and it should not be reported as a measurement. Ian Musgrave, a pharmacologist at the University of Adelaide arguing against creationist claims about Haldane's dilemma, worked with a ceiling of 1,667 beneficial fixations and argued the true number is well below it.65 Estimates of the proportion of amino-acid substitutions driven by positive selection in humans are among the lowest measured for any organism.
Set those side by side:
| over six million years | |
|---|---|
| Harmful mutations fixed permanently (U = 5) | ~333,000 |
| Adaptive fixations, mainstream estimates | ~1,000 to ~20,000 |
The ratio runs somewhere between 17:1 and 300:1 against.
One caveat on that table, raised by Felsenstein and fatal to a naive reading of it. Adaptation does not run only on new mutations: "much of the variation that is being acted on by selection would not be new mutations, but would be existing alleles floating around in the population."36 Standing variation appears in neither column. The comparison above is between two flows of new fixations, and it ignores a third pool that selection draws on without waiting for mutation. That does not dissolve the ratio — standing variation is itself the product of past mutation, and the question is what replenishes it — but anyone quoting "300 to 1" as the whole accounting is overstating what the table shows.
The best counter-argument, and what is actually wrong with it
The Masel group's answer is that this comparison uses the wrong currency. Count effects, not events. In their simulation the beneficial fixations averaged s = +0.0042 while the harmful ones averaged s = −0.000039 — a factor of about a hundred.2 A few thousand large gains can outweigh sixty thousand small losses.
Work their own numbers and something more interesting appears. The beneficial flux is 6,387 × 0.00423 = +27.0 in log fitness. The deleterious flux is 56,255 × 0.0000391 = −2.20. Those do not balance. The beneficial side is twelve times larger, and over the 200,000 generations simulated the population ends up something like 1011 times fitter than it started. Their own text confirms the direction: their reference case gains 10% fitness every 151 generations, indefinitely.2
So their model does not show a population breaking even against Ohta's ratchet. It shows a population adapting without limit, with the ratchet as a modest tax on the way up. That is only possible because the model has an inexhaustible supply of beneficial mutations of constant mean effect — nothing in it makes good mutations harder to find as the genome gets better.
Real genomes do not behave that way, and this is measured rather than argued. In the long-term E. coli experiment the beneficial fraction contracted from 6.8% in the ancestor to 4.3% after 2,000 generations and 3.2% after 15,000, as the population adapted.54 In bacteriophage, Silander and colleagues found the fraction of beneficial mutations was zero in every high-fitness population and greater than zero in every low-fitness one — high-fitness lines under drift declined, low-fitness lines improved, and both converged on the same middle.55
That is genetic entropy, measured, in a mainstream journal — together with the mechanism that stops it. A model without that feedback cannot locate the equilibrium. It can only show that a parameter region with positive flux exists.
None of which is an answer to the information question, and the difference matters.
Their own example of how compensation works: "many proteins accumulate small deleterious mutations that slightly inhibit folding, which can be compensated for by a novel or improved or overexpressed chaperone protein."2
This is also where the claim that adaptation usually proceeds by breaking things has to be sourced rather than asserted. Michael Behe surveyed four decades of laboratory evolution experiments in the Quarterly Review of Biology in 2010 and concluded that adaptive changes are dominated by loss or modification of existing function rather than gain.66 Behe is an intelligent-design advocate, which is a reason to check his survey rather than to ignore it — and he states the limit himself: it "is called a 'rule' in the sense of being a rule of thumb. It is a heuristic, useful generalization, rather than a strict law."66 Jerry Coyne, reviewing it, granted that the observed laboratory changes are indeed mostly loss-of-function while disputing that this extrapolates to the long term. For this article's purposes the granted half is the half that matters. Take that literally. A hundred proteins have been degraded, each at a specific position that used to hold a specific letter. A chaperone is upregulated, and the organism's fitness recovers.
The hundred positions are still wrong. The specific sequences are still gone. What has happened is not repair but compensation — the genomic equivalent of a building with a hundred cracked beams and one very good jack. The building stands. The beams are still cracked, and next generation there will be a hundred more.
And it has been watched happen. Denver and colleagues took a nematode line that had been bottlenecked for 323 generations until it lost nearly half its fitness, let five populations recover for 60 generations, and sequenced the whole genome before and after. Fitness came back. Nothing was repaired:
"We identified 68 base-substitution changes between N2 and MA12; in all 68 cases, the mutation was also detected in each of the three MA12-derived recovery lines. Thus, no reversions of MA12 mutations were detected in the recovery lines."67
"None of the recovery response is attributable to detectable reversion mutations, and no cases of putative intragenic compensatory mutations were identified. Thus, intergenic compensatory mutations likely drive all of the change that we observe."67
Every one of the 68 mutations that degraded the line was still there when it had recovered. The repairs were at different loci from the breaks. That is compensation rather than repair, measured in an animal, by people with no stake in this argument — and it is discussed in full, with its four substantial caveats, on the fitness-effects page.
This is not a creationist observation. Hartl and Taubes made the same point in 1996, in a paper whose subtitle is the whole argument — "Selection without Adaptation." Their abstract: "On a suitably long timescale... every gene incorporates favorable mutations that compensate for detrimental mutations previously fixed. This form of evolution is driven primarily by natural selection, but it results in no change or permanent improvement in enzymatic function."45
The body puts it harder still:
"in a metabolic system near saturation, as well as in a system with an intermediate optimum, most compensatory mutations merely restore, partially or completely, the level of enzyme function to that of the ancestral molecule. There will usually be no overall increase in absolute fitness. On this treadmill, each molecule evolves adaptively but does not improve."45
Selection is running. Fitness is being maintained. Nothing is being built. That is the accounting argument, in Journal of Theoretical Biology, by a Harvard population geneticist, in 1996.
H. Allen Orr put the general version the same year, reviewing Daniel Dennett, and put it better than this article can. Natural selection, he wrote, "'sees' only brute birth, death, and reproduction, and knows nothing of Design," and is "just as happy to lay waste to the kind of Design we associate with engineering as to build it." His example is the cave amphipod Gammarus minus, which retains an optic nerve with little or no eye: "If eyes are expensive to make, selection can wreck their exquisite engineering just as surely as it built it."68 That is the accounting argument, stated by a mainstream evolutionary geneticist who was attacking intelligent design at the time.
This is why the argument cannot be settled by fitness alone. Fitness is a measure of how well you compete today. The question genetic entropy asks is whether the process that is running can have built the specific sequences in the first place, and for that you have to count sequences, not competitive success.
Kondrashov already answered this, in 1995, and the answer is the article's own
The Masel resolution is that a smaller number of larger-effect beneficial fixations counterbalance the deleterious ones. That is not a new proposal. It is Kimura's, and Kondrashov named it and rejected it in the paper that defined the paradox:
"According to Kimura (1983: 248) VSDMs do not cause any problem because (i) they accumulate very slowly and (ii) their impact can be easily counterbalanced by rare fixations of beneficial alleles. I do not think that this is correct."3
His reason is a constraint on where beneficial mutations can even occur, and it is the sharpest statement of this article's argument that exists anywhere:
"A beneficial mutation is possible only in a site occupied by a suboptimal nucleotide. This implies that either a VSDM was previously fixed at this site (in this case the beneficial mutation can have only a very small advantage) or that the environment has changed (then the mutation can be significantly beneficial)."3
Read what that does to the balance sheet. A beneficial mutation has somewhere to happen only if a site is already wrong. If it is fixing a site that a very slightly deleterious mutation broke, its advantage is by definition very slight — you cannot recover more than was lost. The only way to get a large beneficial effect is if the environment moved, and that is a lag load being paid down, not a repair of the genome.
So the Masel model's parameters are in tension with the mechanism. Their resolution needs beneficial fixations averaging about a hundred times the effect of the deleterious ones.2 Kondrashov's constraint says the repairs available to a degraded site are the same size as the degradation, and anything bigger is coming from environmental change rather than from fixing what broke. Neither paper cites the other on this point, and it is the crux.
Ohta had described the same pairing sixteen years earlier and got the size right: "it is likely that a slightly deleterious base substitution is followed by a slightly advantageous (compensatory) substitution."30 Slightly deleterious, then slightly advantageous. Nobody in this literature who works the mechanism through arrives at large compensating effects.
The honest counter, which their side would make. Compensation need not occur at the broken site — a better chaperone can offset a hundred misfolded proteins at once, which is their own worked example. That is a large-effect beneficial mutation that is not repairing any of the broken sites. Kondrashov's constraint bounds repair; it does not bound compensation.
Which is exactly the distinction this whole article turns on, arrived at from the opposite direction. Fitness can be rescued by compensation of unbounded size. Sequence can only be restored by repair, and repair is bounded by how small the original damage was. Kondrashov saw the fitness half of this in 1995; the sequence half is what remains unmeasured.
Two more sentences from the same paper belong here, because both anticipate objections raised against this article thirty years later. On whether an equilibrium rescues the situation: "the assumption that there is an equilibrium contamination can only underestimate the impact of VSDMs."3 And on the lag-load complaint that Argument 1 concedes: "If all individuals indeed carry many lethal equivalents of VSDMs, the perfect mutation-free genotype is rather different from the best available one, even if this does not directly translate into high mutation load."3 He is conceding the load point and keeping the contamination point — which is this article's structure exactly.
The information objection, stated by the people best placed to state it
There is a formal mainstream treatment of exactly this question, and it does not go the way this article would prefer.
Hledík, Barton and Tkačik asked in 2022 how much information a population can accumulate and hold, measured properly — as the divergence between the actual distribution of genotypes and what drift alone would produce — and how much fitness cost that maintenance charges. Their result is the opposite of the intuitive one:
"Selection is most efficient when it is relatively weak (Ns≪1), maintaining up to N/μ(1+4Nμ) bits per unit cost at the genotype level, and inefficient when strong (Ns≫1), maintaining only about ln(2)/μ bits per unit cost."69
Weak selection — the regime just at and below the drift barrier, the regime this article has spent ten thousand words calling a blind spot — is where information is held most cheaply. And they add that capacity is not the binding constraint: "Typical populations have Ne/μ much greater than the genome size, suggesting that the genome size or other factors are more limiting."69
Three things about this.
It is right, and it is a genuine problem for the crude version of the argument. Anyone claiming that sub-drift-barrier sites carry no information, or that the genome's information capacity is exhausted, is contradicted by a careful PNAS paper. This article does not make that claim and should not be read as making it.
But their information is frequency information, not sequence identity. Their measure asks how far a site's allele frequency has been pushed away from the neutral expectation. A site sitting at 60/40 instead of 50/50 contributes a fraction of a bit. That is a real and well-defined quantity, and it is not the quantity in dispute. The question here is whether a splice site still reads GT, not whether its frequency distribution is skewed. A population can be rich in the first kind of information while losing the second, and their framework does not distinguish the cases.
And they say the limit themselves. Their own closing caution is that "more work is needed to make claims about the information content of any real organism's genome."69 That is the correct position, and it is this article's position too. Nobody has done this measurement on a real genome. Until somebody does, the accounting argument is an open question with a strong prior on each side and no decisive data — which is what the last section of this article says.
The measurement everybody skips: beneficial how?
Here is a gap that runs through this entire literature, including the parts of it this article relies on.
Every number quoted for "the beneficial fraction" is a fitness measurement, and fitness measurements are blind to mechanism. When Firnberg's scan reports that 7.0% of β-lactamase missense mutations raise fitness, the measured quantity is growth under ampicillin.60 Nothing in that assay distinguishes a mutation that improved the enzyme's catalytic machinery from one that broke a regulatory brake, disabled a competing pathway, or dumped a protein the cell was paying for and did not need in a flask. Couce's E. coli scan, Böndel's Chlamydomonas fits, and the mutation-accumulation lines are the same: fitness in, fitness out.54 13
That matters because Argument 3 is not a claim about fitness. It is a claim about whether specific functional sequence is being built as fast as it is destroyed. A beneficial-mutation rate cannot be converted into a construction rate without knowing what fraction of those beneficial mutations built anything — and that fraction is not in the papers the rate comes from.
What has been measured points one way, and it is not a creationist result. Hottes and colleagues screened transposon libraries and found that "even under conditions of extreme nutrient limitation, substantial adaptation can be achieved solely through loss of function mutations, which rewire the metabolism of the cell without gain of enzymatic or sensory function." Across their survey, "at least one beneficial null mutation was identified in all but five of the 144 conditions considered."70 Adaptive destruction is available almost everywhere anyone has looked. A 2024 meta-analysis of 58 studies and 65 evolution experiments concludes that "loss-of-function mutations play a basic role in rapid adaptation to ecological conditions."71 Michael Behe's survey of laboratory evolution reached the same conclusion earlier and was granted on the observation by Jerry Coyne, as discussed above.
Now the honest limits, because this point is routinely overstated.
The meta-analysis found nonsense substitution significantly exceeding synonymous substitution in 17 of 65 experiments, not in most of them — and its own summary of the aggregate is a null: "the rate of accumulation of nonsense mutations and synonymous mutations was approximately equal during short-term evolution (dNONSENSE ≃ dS)."71 That sentence sits in the body of a paper whose title is "Loss-of-function mutations are main drivers of adaptations," and anyone citing the title owes the reader the sentence.
So "loss of function is a major route in short-term lab adaptation" is supported. "99% of beneficial mutations are destructive" is not a number anybody has measured, and stating it would be inventing precision the literature does not have.
Not all adaptive change is destruction, and two of the counter-examples come from inside the argument's own camp.
Regulatory mutations that retune expression are not obviously breaking anything, and the one study that sorts adaptive mutations by locus finds the answer depends on which gene you look at. Lang and colleagues sequenced forty evolving yeast populations. Their adaptive drivers overall are "enriched for nonsense and frameshift mutations," which is the destruction thesis holding. But the spectrum splits by function. At mating-pathway and Ras-regulator loci they saw 14 missense, 8 nonsense and 10 frameshift, "suggesting that selection at these loci is for loss of function." At cell-wall assembly loci all 13 mutations were missense, "suggesting that at these loci selection is for alteration or attenuation, not loss, of function."72
That is the shape of the real answer. Destruction is a large and probably dominant share of short-term adaptation, and it is not the whole of it. Which one you get depends on the gene.
And the E. coli long-term experiment's most celebrated event — aerobic citrate use — arose when a duplication placed an existing transporter under a new promoter. By Michael Behe's own published definition that is a gain of function, since his criterion for gain-of-FCT is "the construction by mutation of a new promoter." It is the single clearest counter-example to the destruction thesis, and it should be conceded by anyone advancing that thesis rather than left for a critic to produce.
Genuine construction from nothing is rarer but documented base by base. The antifreeze glycoprotein of northern cod was traced to its origin, and the authors state the result without hedging: "We experimentally proved that all genic components of the extant gadid AFGP originated from entirely nongenic DNA."73 The same function evolved independently a second time in Antarctic fish, from a digestive enzyme gene. Two independent origins of a real innovation.
And gene loss is not always a dead end. Helsen and colleagues deleted genes in over 200 yeast lineages and found that loss "can facilitate adaptation by opening alternative evolutionary paths," with some deletion strains eventually beating adapted wild-type.74 Destruction that increases evolvability is a real mainstream answer, and it has to be counted.
And when the "less is more" literature is asked for a fraction rather than a slogan, the fractions are small. This is the part that never gets quoted, so it is quoted here.
Xu and colleagues identified 60,819 loss-of-function variants across 1,071 Arabidopsis genomes — the largest such survey there is. Their adaptive yield: "in the Yangtze River basin population, 1% of genes with LoF mutations were under positive selection," and "0.9% of LoF variants with minor allele frequency larger than 0.5% are associated with climate change."75 The review built on that work is titled Less Is More, and concedes in its own abstract that "although most LoF mutations are neutral or deleterious, at least some of them are under positive selection."76
The cleanest adaptive-versus-neutral denominator in the field comes from whales. Huelsmann and colleagues screened the cetacean stem lineage and "found 85 gene losses," of which about eleven are given an adaptive story. Their own summary of the rest: "Many of these gene losses were likely neutral, and their loss happened because of relaxed selection to maintain their function."77
On crop domestication the literature flatly contradicts itself. Gross and Olsen, counting the same genes, write that "most of the domestication alleles characterized to date are not loss-of-function mutations."78 Anyone citing domestication as a showcase of adaptive destruction has to deal with that sentence first.
A caution that cuts against the comparative-genomics gene-loss numbers generally. Natsidis and colleagues fed simulated data containing zero real gene loss into the standard orthology pipelines and reproduced the published pattern anyway, concluding that such results "may well have been based on a misleading signal." In fairness the same critique damages the gain counts — homology detection failure inflates those too — so the net effect on any loss-to-gain ratio is unknown rather than known to favour either side.79
Albalat and Cañestro's review poses this article's exact question — what fraction of adaptive mutations are loss-of-function? — declines to answer it for want of data, and reports that in multicellular life "the fixation of most gene losses is driven by neutral evolution."80
The strongest form of the argument, then, is not a percentage. It is that the field measures the wrong variable for this question and then uses the answer as though it were the right one. Until somebody reports a distribution of fitness effects with the beneficial side classified by mechanism — repair, retuning, deletion, duplication, genuinely novel function — the beneficial rate that every balance calculation in this dispute depends on cannot tell you whether the genome is being built or merely re-tuned while it erodes. That measurement is achievable with existing technology. Nobody has published it.
The construction side, measured by the other camp
The article's own arithmetic covers the destruction rate. The best quantitative attempt at the construction rate comes from Sanford's group, and it is peer reviewed in a secular journal, so it belongs here on its merits rather than as a target.
Sanford, Brewer, Smith and Baumgardner simulated a pre-human hominin population of at least 10,000 with strong selection — half the population eliminated each generation — and asked how long it takes to establish a specific short string of nucleotides. Two nucleotides took an average of 84 million years; five took 2 billion; eight took 18 billion, longer than the age of the universe.81
Two honest caveats. The model asks for a pre-specified target string, and evolution does not work toward targets — a critic will say the waiting time for "some useful string" is far shorter than for "this string," and they are right in principle. And their simulator is the one discussed above. But the qualitative point survives both objections and is not seriously disputed: multi-nucleotide functional elements that require several specific changes before conferring any benefit are extremely slow to arise, and that is the side of the ledger evolution has to fill.
What would settle it
Not the beneficial mutation rate. That is worth stating carefully, because it is the thing creationist sources usually attack and they are attacking the wrong number. Masel's reference value of U_b = 0.002 works out to about one beneficial mutation per 35,000 — which is between 300 and 2,000 times lower than every direct measurement of the beneficial fraction, which run from 1% to 7%.60 54 82 Their assumed rate is conservative, not optimistic, and their own analysis says the rate is not the binding constraint anyway: "The mean beneficial effect size s̄_b is more important than the beneficial mutation rate U_b."2
What would settle it is a harder question, and it is the one nobody can currently answer:
What is the mean effect of the beneficial mutations actually available to a genome that is already well adapted, and does that supply contract as fitness rises?
Couce and Silander both measured a contraction. Neither measured it in a large-genome sexual species over evolutionary time. Masel's own paper concedes the uncertainty: "there is great uncertainty in the true values of U_b and s̄_b."2
And the reason nobody has a better number is not neglect. It is that the measurement cannot currently be made, and the people who build the instruments say so. From Dmitri Petrov's laboratory, in 2023:
"Given the importance of measuring microbial fitness in diverse fields, it is frustrating that we cannot measure fitness more precisely. Reported precision remains capped at detecting fitness differences on the order of 0.1–1%."83
And four sentences later, they state this article's question in their own words:
"natural selection can distinguish fitness differences that are orders of magnitude smaller than we can measure in the laboratory, depending on effective population size. This creates a problem for scientists: how do we understand the fitness effects of mutations if many of these effects are too small for us to measure precisely?"83
A related limitation appears in one inference from human sequence data. Johri, Pfeifer and Jensen tested how much positive selection human exome data can rule in or out, and concluded: "although strong and/or frequent recurrent positive selection is inconsistent with observed data, weak to moderate positive selection is consistent but unidentifiable if rare."26 With 0.1% or 1% of new mutations beneficial at 2N_e s_b of 10 or 100, "there is almost no difference between the distribution of statistics across the 465 exons in the absence versus presence of positive selection," which they say "suggests a general inability to identify this class of mutations, if present."26
That test leaves the specified rare beneficial classes difficult to distinguish from their absence. It does not establish the beneficial rate, whether beneficial effects balance harmful ones, or what a different method could identify.
And there is a second missing measurement, which is easier than the first and which nobody has run:
Of the beneficial mutations that do occur, what fraction build functional sequence rather than remove it?
Every beneficial fraction in this dispute is a fitness number with no mechanism attached. Classifying the beneficial side of a deep mutational scan into repair, retuning, deletion, duplication and novel function is achievable with current sequencing and structural tools. Until it is done, the construction rate that Argument 3 turns on has never actually been measured — only a proxy for it that cannot distinguish building from pruning.
What the experiments show
Theory is cheap. This section is what happens when people actually stop selection and watch.
Mutation accumulation lines
The direct test is to breed organisms through a bottleneck so tight that selection can barely operate — a single individual or a single brother-sister pair per generation — and measure fitness against a frozen ancestor. Anything that accumulates has to be mutation.
The results, honestly reported, are a mess, and the mess is the point:
| Organism | Generations | Fitness lost per generation |
|---|---|---|
| Drosophila, Mukai 1972 | 40 | 0.40% |
| Drosophila, Fry 1999 | 27–33 | 0.24% |
| Drosophila, Fernández & López-Fanjul 1996 | >100 | ~0.10% |
| Drosophila under competition, Shabalina 1997 | 30 | 2.0% |
| C. elegans, Vassilieva 2000 | 100+ | ~0.10% |
| C. elegans, Baer/Matsuba 2012 | 400 | 0.115% |
| E. coli, Kibota & Lynch 1996 | 7,500 | 0.00027% |
| Yeast (wild type), Zeyl & de Visser 2001 | 600 | 0% |
| Arabidopsis, Shaw 2000 | 17 | no significant change |
Three things follow.
First, fitness does decline in animals under relaxed selection, and by a lot more than in microbes. Flies lose a fraction of a percent per generation, and Shabalina's competitive assay — which measures fitness the way nature does, against rivals, rather than in a comfortable vial — found 2% per generation, ten times the benign estimate.84 That gap between "benign" and "competitive" measurement recurs throughout this literature and it always runs the same way.
Second, the estimates disagree by a factor of 700. Katju and Bergthorsson's review of every eukaryote MA study puts the range of measured genomic deleterious rates at 0.00065 to 0.47 per generation.85 Anyone quoting a single figure from this literature — in either direction — is choosing.
Third, and this cuts against genetic entropy: degraded lines recover fast. Estes and Lynch took C. elegans lines that had been degrading for 240 generations, put them back in a large population under selection, and measured full restoration of fitness in under 80 generations — a recovery rate "at least three times that of mutational degradation."86 Katju's 2015 experiment found that at population sizes of 10 or 100 rather than 1, there was no significant decline at all over 409 generations.87
That last result is the strongest empirical evidence against the strong form of genetic entropy, and it should be stated without softening. Selection at modest population sizes stopped the decline. What it does not settle is the fate of the mutations below the blind spot at that population size, which is where the whole argument lives — a 409-generation experiment at N = 100 cannot see a process that operates on the scale of 4N generations and effect sizes of 1/(2N).
Error catastrophe in viruses
Raise a virus's mutation rate with a drug and it dies. This is not disputed and it is the basis of real antiviral therapy.
Crotty, Cameron and Andino gave poliovirus ribavirin at 1,000 μM, raised the mutation rate 9.7-fold, and measured a 99.3% loss of genome infectivity in a single round of replication.88 Loeb and colleagues drove HIV to extinction in 7 of 9 cultures with a mutagenic nucleoside, against 0 of 28 controls.89 Favipiravir cleared norovirus from 7 of 9 treated mice.90 Mutator mice — carrying a defective DNA polymerase, with a 17-fold elevated mutation rate — showed 4.1 times more abnormal phenotypes, dropping fertility to 36% of baseline, and many breeding lines died out.91
But the honest reading of this literature is more limited than creationist summaries usually admit, in four ways.
The mechanism is not what it is usually called. Bull, Sanjuán and Wilke showed that killing a virus with mutations is not Eigen's "error catastrophe" — it is simply lethal mutation accumulation, a different and less exotic thing.92
The rates required are enormous. A 2025 analysis across six viruses concluded that lethal mutagenesis needs mutation-rate increases of 11-fold to 2,700-fold, while actual drugs deliver at most about 10-fold: "lethal mutagenesis seems difficult to achieve."93
Molnupiravir did not sterilise SARS-CoV-2, and it did not obviously drive it either. Sanderson and colleagues found branches carrying 20 or more mutations with the drug's characteristic signature, including a 20-tip transmission cluster in Australia.94 Raising the mutation rate produced viable, transmissible descendants — which is the point that matters here. It should not be stretched further than that: no molnupiravir-derived lineage has become a named variant, and the honest summary is that heavily mutated lineages survived and went nowhere in particular.
And there is a clean counter-experiment. Springman, Keller, Molineux and Bull mutagenised phage T7 at 100 to 1,000 times its normal rate, giving 4.3 non-lethal mutations per genome per generation. Theory predicted fitness would fall from 18.3 to 8.6 doublings per hour. Instead, after 200 generations, fitness rose to 21.9. The authors write that the "failure of the theory challenges the quantitative basis of lethal mutagenesis."95
That last result is the single best experimental argument against genetic entropy and it belongs in any honest treatment. The most likely explanation is arithmetic: at 2.6 deleterious mutations per generation, a virus producing more than e^2.6 ≈ 13 copies of itself will, on average, produce one with no new mutations at all. Selection can then pick that one. Viruses have burst sizes in the hundreds. Mammals have litters. The difference between a phage and a human here is not a detail — it is the whole argument, and it runs in genetic entropy's favour rather than against it.
The human data
The strongest single result is also the most misused. Fu and colleagues sequenced 15,336 genes in 6,515 people and found that 86% of the variants they classed as deleterious arose within the last 5,000 to 10,000 years, with a mean age of 5,200 years for European Americans.96
And there is a second thing creationist material never quotes: how the 5,000-year figure was obtained. It is not a measurement of variant ages. It is the output of a fitted demographic model — specifically "a modified Out-of-African model in which accelerated population growth began 5,115 years ago with a per generation growth rate of 1.95% and 1.66%" for the two ancestry groups.96 The ages come out of the model; they do not go into it.
To their credit the authors tested how much that matters, and report that estimates "were generally robust across different demographic models, with the largest discrepancies resulting in a two-fold difference in average age across all SNVs."96 That is a real robustness check and it should be reported alongside the criticism.
But notice what it does and does not cover. Every model in the family they tested is a deep-time out-of-Africa history. Robustness within that family is not robustness of that family. Anyone using this result while rejecting the demographic history is quoting a number that was manufactured by the history they reject — which is the distinction drawn in which numbers are measurements above, and this is the cleanest example of it in the whole article.
Creationist material quotes this constantly. It should also quote the authors' explanation, which is not genetic entropy: human populations exploded in size recently, and a rapidly growing population accumulates rare variants faster than selection can purge them. Fu's own model fits the acceleration starting 5,115 years ago with per-generation growth of about 1.95%.96 The recent origin of deleterious variants is a demographic signature. It is consistent with genetic entropy but it is not evidence for it over the mainstream explanation.
What the rest of the human data shows:
- The average person carries about 100 genuine loss-of-function variants, with about 20 genes completely inactivated.97
- 7.7% of Icelanders are complete knockouts for at least one gene, across 1,171 genes.98
- Every person carries roughly 400 highly damaging missense variants and around 2 bona fide disease mutations.99
- Neanderthals carried a mutational load implying median fitness around 0.63 of modern humans, and the Altai Neanderthal's genome scores worse than 97% of present-day people.100 101
And the counter-evidence, which is real and cuts both ways. The same ancient-DNA study reports two findings that do not sit comfortably together. Genomic health improved from the deep past toward the recent past — the opposite of a simple "decaying since the beginning" model. But individuals from the last few thousand years score healthier, on average, than people alive today.101 The authors themselves note the pattern is "perplexing." Neither side gets a clean result out of this, and any article claiming otherwise is picking half the paper.
On measurable decline in modern populations: Kong and colleagues found that polygenic scores for educational attainment declined in Iceland by about 0.010 standard units per decade of birth year across 129,808 people — real, statistically solid, and small: an implied 0.30 IQ points per decade against a Flynn effect of +3.0 points per decade running the other way.102 Beauchamp found selection against education in the United States at about 1.5 months per generation.103 These are genuine measurements of ongoing genetic change in a fitness-relevant trait. They are also two orders of magnitude too small to be visible in a human lifetime, and they measure selection under modern conditions, not the deep past.
The forecast from the drift-barrier school is larger than either measurement. Michael Lynch, who holds that most of the human genome is junk and so cannot be accused of inflating U, worked the cost of relaxed selection in 2010: "with a complete relaxation of natural selection, the expected decline in fitness associated with mutations in coding DNA alone appears to be on the order of 1% to 3% per generation."104 That is the same size as the Crow figure Sanford uses, reached independently from mutation data. Two limits come with it, both Lynch's own. It is a forecast for industrialized societies under relaxed selection, not a measured decline. And because the human population is now so large, the new harmful alleles "will remain at very low frequencies for many centuries, so the damage incurred under the scenario outlined earlier need not be permanent."104 So a mainstream estimate does put the cost of fully relaxed selection at 1 to 3% of fitness per generation. Selection is not fully relaxed, as the results below show, and the cost Lynch describes is rare harmful variants piling up, which is reversible. Argument 2 is about fixations, which are not.
Three results published since 2022 cut hard against a simple decline picture, and they belong here rather than in a footnote.
Selection is still running on living people. Chen and colleagues analysed 509,817 variants across 72,635 Han Taiwanese and looked for allele frequencies that shift with age — the signature of selection acting now. They "detected 168 variants deviating from neutrality, with most showing declining frequencies in younger generations, consistent with purifying selection on deleterious alleles influencing disease risk."105 That is purifying selection observed within living memory, in a population with universal health coverage.
And it has a mechanism medicine does not fix. Gardner and colleagues found in Nature that variants which ablate protein-coding genes are "associated with markedly reduced reproductive success, primarily owing to increased childlessness," and that this "may account for 20% of purifying selection against heterozygous variants that ablate protein-coding genes."106 The route is behavioural — carriers are less likely to find a partner — which no clinic addresses.
And over the Holocene, the trend ran the other way on the traits people worry about. Akbari and colleagues measured selection across 15,836 ancient West Eurasians spanning 18,000 years and found "negative selection on combinations of alleles that today increase body fat percentage," against psychosis-associated alleles, against "alleles contributing to overall health decline," and for higher scores on cognitive and educational predictors.107
How much do these cost the argument? Less than they look, and the reason is the same one this article keeps arriving at. Every one of them measures selection where selection can be seen. Akbari's standard error on a selection coefficient is about 0.17%. Agarwal and colleagues put the median cost of losing a gene copy at 1.8%.108 Chen's method needs an effect large enough to move an allele's frequency across age groups within one lifetime. The drift barrier for humans is 0.005%.
So these results establish something worth granting plainly — selection has not been switched off, and the popular claim that modern medicine has abolished it is false — without touching the band the argument is actually about. None of them measures the sign of selection on a mutation costing less than 1/(2N_e). That is not a criticism of the studies; it is a statement about what is currently measurable.
One honest complication in the other direction. Two of the three depend on polygenic scores built in modern industrialised populations, and Akbari's authors say so themselves: those traits "are only relevant to modern societies and would have been unmeasurable in preliterate societies over the vast majority of the period during which selection acted."107 They also note the behavioural signals largely stop about 2,000 years ago, and that the educational trend has reversed in Iceland over the past century — which is the Kong result quoted above. The sign of selection on a measured trait is not a fixed thing.
Small populations: the cleanest natural experiment
Conservation genomics has been running the experiment this argument needs, on species that went through severe bottlenecks, and the result is a two-tier pattern both sides should find interesting.
The best single case is the saola, a critically endangered Vietnamese bovid whose genomes were published in Cell in 2025 by 34 authors with no stake in this debate. Purging removed roughly two thirds of the genetic load the species would otherwise have carried -- and the load that actually gets expressed rose anyway over the last 10,000 generations. Their own summary: "genetic drift leads to an increase in the mildly and slightly deleterious mutations, while purging reduces overall genetic load by removing the strongly deleterious recessive mutations."109
Two more results sharpen it. A 2024 study of 502 European barn owls found island populations enriched in every category of deleterious allele with no purging at all, and concluded that only populations "with an effective population size of a few hundred or less can undergo purging" -- while adding that such populations "will usually also incur an additional cost of increased lowly and mildly deleterious mutations."110 And the Florida panther's celebrated genetic rescue did not remove deleterious variants: loss-of-function alleles per individual actually increased, while homozygous ones fell.111 The rescue worked by masking, not repair, and the authors' simulations have fitness declining again within twenty generations.
The counterexample, stated first. A 2025 Heredity paper reports long-term purging of non-synonymous mutations as a class in North Atlantic killer whales, not only the strongly deleterious ones.112 If that holds it reaches into the tier this argument says selection cannot clean. Three caveats: "non-synonymous" lumps strong and mild effects together, the authors attribute part of the signal to linked-selection artefacts rather than clean purging, and no fitness was measured. The full text is embargoed until December 2026, so the published numbers cannot currently be checked.
And the strongest sentence against the whole thesis comes from the modellers whose distribution of fitness effects the saola study used: "empirical evidence for mutational meltdown occurring in wild populations remains scarce, thus its importance as a genetic driver of extinction remains in question."113 They are right about meltdown specifically, and an article claiming otherwise would be overstating it.
But there is one cross-taxon empirical test, and it is co-authored by the man who named the paradox. Polishchuk, Popadin, Baranova and Kondrashov took 211 mammal species, used the ratio of non-synonymous to synonymous substitution in mitochondrial DNA as a genetic proxy, and asked how much of extinction risk it accounts for once the dominant ecological predictor is controlled for. Their answer: "Ka/Ks and body mass are responsible for a 38% and a 62% increase in extinction risk, respectively," with genetic factors contributing roughly one quarter to one half of the combined effect.114
Three caveats, all theirs or obvious. Ka/Ks is a proxy for accumulated mildly deleterious substitution, not a measurement of load. It is mitochondrial, so it says nothing directly about the nuclear genome where most of the argument lives. And a correlation across species is not a demonstration of mechanism in any one of them.
What it does establish is that the honest answer to "no field evidence" is "less than you would want, but not none" — and that the one study that looked found a genetic signal roughly half the size of the strongest ecological one.
A 2026 result splits the difference in a way that is bad for the popular creationist reading and interesting for this one. Mawass, Hernández, Matheson, Berg and Masel — the same lab as the fixation counts above — asked what actually drives a small population into an extinction vortex, and separated two candidates: mutational meltdown, where deleterious mutations fix, and mutational drought, where a small population simply generates too few beneficial mutations to keep adapting. Their result:
"In stable environments, we find that mutational drought is nearly as significant as mutational meltdown. Drought is more important than meltdown when populations must also adapt to a changing environment unless the beneficial mutation rate is extremely high."115
Read that both ways, because it cuts both. It undercuts pointing at bottlenecked species and calling their decline a demonstration of mutation accumulation — at best that is half the story, and in changing environments less than half. And it makes the supply of beneficial mutations the quantity that decides whether a population survives, which is exactly the parameter Argument 3 says nobody has measured in a large sexual species. Two independent lines of work now converge on the same missing number.
Where the creationist case is weak
An article that only listed the other side's problems would be worth nothing. Here are ours.
Almost all of them are in one book, and repeating the audit here would only invite the two copies to drift apart — which is exactly how a misquotation got into this article once already. The full page-by-page treatment is a separate article. This is the summary.
Seven documented errors in Genetic Entropy, the book that made this argument known, and in the work that grew from it. The first five are in every edition of the book; the sixth is in a 2015 follow-up paper; the seventh is in the 2014 edition's appendix.
- A key quotation is cut where it becomes inconvenient. Sanford prints Eyre-Walker and Keightley's 1999 Nature sentence ending "...it is doubtful that such species could survive," with the condition removed. The original ends "could survive if mutational effects on fitness were to combine in a multiplicative way," and the authors' next sentence says their results indicate they do not. A rejected premise is converted into a bare prediction of extinction.
- The headline decline rate is run backwards through history. Figure 4 projects Crow's 1% per generation over 300 generations. Crow's number is an extrapolation from Drosophila, located explicitly in "the past few centuries" and "the wealthy nations," and he says in the same paragraph that it "is more than compensated for by much more rapid environmental improvements."
- The heritability of fitness is the wrong quantity. Three chapters rest on h² = 0.004, cited to Kimura. Kimura's figure is a broad-sense H², from one Drosophila study, deployed by him as an objection to a position Sanford is arguing for. And the book never says what its 1-in-250 measures: 250 is right for the share of selection passed on (R/S = h²), while the response in additive-genetic standard deviations scales with the square root (R/σ_A = i·h) and costs a factor of about 16. Neither the book nor its critics named the currency. A direct measurement now exists and lands between the two: about 3% across 19 wild vertebrate populations.40
- A number is attributed to the wrong person. Sanford writes that Kimura "states that only 138 sites can undergo selection simultaneously." The 138 is Maynard Smith's, for a model he was arguing against; the figure he advocates on the same page is 25,500.
- The most-reproduced figure assumes its own conclusion. Figure 3d's mirrored beneficial hump is asserted — "a reverse image of Kimura's curve" — with no source. Kimura's axis is labelled "Selective disadvantage" and runs entirely on the harmful side, so there is nothing to mirror.14 14 Reflect the deleterious curve and every beneficial mutation is tiny by construction, therefore inside the box, therefore unselectable. The figure does not demonstrate that; it draws it.
- The long-term E. coli experiment is read backwards. Christopher Rupe and Sanford's 2015 paper, published by Sanford's own foundation, calls Lenski's experiment "one of the most powerful demonstrations of genetic entropy and de-evolution."116 Its Figure 1 caption assigns the unbounded power-law curve to the claim that fitness "has reached a near maximum," and the bounded hyperbolic curve to Lenski.116 Both attributions are reversed: Wiser, Ribeck and Lenski's 2013 abstract says "Mean fitness appears to increase without bound, consistent with a power law."117 Fitness kept rising past 50,000 generations, in the mutator lines as well.
- The cap on beneficial mutations is argued in one currency and used in another. Every Mendel's Accountant run caps how much a beneficial mutation can raise fitness, at 0.001 or 0.01, and the declines depend on that cap. The only defence of it, in the 2014 edition's Appendix 5, is about information: a beneficial mutation "should only increase information by about one part in 3 billion."118 The same appendix says an antibiotic-resistance mutation raised fitness "infinitely, going from zero to one" while losing information.118 By Sanford's own reasoning, then, the information cap does not limit fitness gains, and it is the fitness number that goes into the simulator.
Four editions across nine years fixed none of the first five. The only textual changes are a widened parenthesis, one added clause, and "even as low as" softened to "perhaps as low as."
The sharpest criticism of the method comes from inside the intelligent-design camp. Douglas Axe, publishing his own genetic-entropy result in 2023, writes that in models of this kind "the statistics that come out of these models are dictated by the statistics that went in," and notes that a Nelson and Sanford run reverses itself once large beneficial mutations are allowed to occur. He accepts the conclusion and rejects the evidence for it.
And the movement has published almost no original work on its own flagship argument. The Creation Research Society Quarterly has run for sixty-two years; a full-text search of its archive finds five papers that mention genetic entropy at all, every one citing Sanford's book in passing. No creationist journal has published a measured or simulated distribution of fitness effects. The quantitative work lives in conference proceedings, one symposium volume, and three papers in a journal that ceased publication in 2021.
The influenza argument is the weakest part of the case
Carter and Sanford's 2012 paper argues that human H1N1 influenza has been degrading since 1918 and went extinct twice. In their words: "We document multiple extinction events, including the previously known extinction of the human H1N1 lineage in the 1950s, and an apparent second extinction of the human H1N1 lineage in 2009. These extinctions appear to be due to a continuous accumulation of mutations." By 2009 the lineage had gathered "over 1400 point mutations (more than 10% of the genome)," at a steady 14.4 a year.119 They grant that "Herd immunity is undoubtedly an important factor in reduced H1N1 mortality since 1918," and argue it "may not be sufficient" to explain the decline.119 The mutation counts are real. The inference from them is the weakest argument in the creationist case, for four reasons that do not require any theoretical commitment to see.
The paper measures no fitness. Fitness in virology means replicative or transmission success, measured by competition assay. None was run. The two substitutes are case-fatality rate, which is not fitness — standard virulence theory expects selection to reduce lethality, since killing hosts truncates transmission — and codon bias, which assumes influenza was once adapted to human codon usage and has drifted away from it. It never was.
The turnover dates do not fit a clock. H2N2 replaced H1N1 in 1957 after 39 years. H3N2 replaced H2N2 in 1968 after 11. A lineage dying of accumulated load at 11 years of age, while another survived to 39, is not a clock. Immune-driven replacement explains both, and the 2009 replacement as well.
The strain that should be furthest down the ratchet has not collapsed. H3N2 has circulated in humans continuously since 1968, 58 years, longer than the H1N1 lineage did before 1957. The mainstream modellers who study its load put the question carefully. Katia Koelle and David Rasmussen grant that "one might expect the virus population's deleterious mutation load to increase in the long run, causing a long-term decline in influenza A/H3N2 fitness," name two brakes (a rising share of beneficial mutations as fitness falls, and reassortment that recombines low-load segments), and note a measured fall since 1968 in how well H3N2 binds human receptors. Their verdict on that fall: "Whether this finding can be interpreted as evidence for a 'weakening' of the virus over time is unclear, especially because 'weakening' by any epidemiological measure has not been empirically demonstrated."120 A decline in H3N2 is therefore an open question in the mainstream literature, not a closed one, but nobody has shown one.
And there is a clean control. Influenza B/Yamagata has not been confirmed in circulation since March 2020, after COVID-19 measures changed how influenza spread worldwide.121 A lineage that had circulated for decades disappeared within a season, and the timing points to transmission, not to accumulated damage. Influenza lineages go extinct for ecological reasons, so extinction alone is not diagnostic of mutational decay.
What does survive is smaller and worth stating. Slightly deleterious mutations genuinely do accumulate in influenza: Koelle and Rasmussen cite three phylogenetic studies showing that human H3N2 "carries a deleterious mutation load."120 And their own simulation of H3N2 shows how the stability of that load is set. To stop Muller's ratchet in a simulated population, they had to make a share of non-antigenic mutations beneficial, and "we set εc to a value of 0.16, which resulted in a stable deleterious mutation load over time."120 They put the need down to the small number of hosts a computer can simulate, and real influenza populations are vastly larger, so this is not evidence that real influenza is ratcheting down. It does show that in this model the balance comes from a chosen beneficial fraction, not a measured one, which is the gap Argument 3 is about. All of this illustrates the mechanism. It is not proof of the conclusion, and this article does not use it as one.
Mendel's Accountant is not the neutral instrument it is presented as
Most creationist quantitative work on this subject runs through Mendel's Accountant, a simulator written by Sanford, John Baumgardner and colleagues. Its central abstraction — dividing genomes into linkage blocks carrying summed mutation effects — is legitimate, and the Masel lab independently adopted the same design in their own code.122 But its selection algorithm has genuine oddities that neither side has fully resolved.
The most interesting episode is worth recording because of who found it. In 2015, arguing with a critic on Uncommon Descent, the author of this site's research notes ran a test on Mendel's "probability selection" scheme, comparing an individual of fitness 1.0 to one of fitness 1.1 a million times. The fitter individual won 20% more often, not 10%. Joe Felsenstein, a population geneticist and no friend of creationism, agreed with the finding: "If the fitnesses stand in the ratio of 1.1 : 1.0 then Genghis Khan should be 10% more likely to survive. But owing to (perhaps) the truncation you find him 20% more likely to survive. The truncation part is not in standard population-genetic models."36
The direction of that bug matters, and it is itself disputed. On the reading above it makes Mendel's selection stronger than standard theory, which means Mendel understates mutation accumulation rather than exaggerating it. A 2009 analysis reached the opposite conclusion about the same line of Fortran — work_fitness(i)/(randomnum(1) + 1.d-15) — arguing that dividing by a uniform random number "largely erases any signal from adaptive fitness," making selection weaker and the meltdown "an artifact of bad programming."123 Both claims are about one line, and no mainstream population geneticist has adjudicated between them; Felsenstein declined, saying he could never obtain the documentation and that the program "has too many arbitrary processes." A year later the same author publicly withdrew the "twice as efficient" claim as possibly an error of his own: "I'm also no longer sure about the comment I made a year ago that selection in Mendel is 'TWICE as efficient as it should be.' It's possible I could be off by two somewhere."124
None of this is why the article does not rely on Mendel's Accountant. It does not rely on it because it does not need to. Every number here comes from equations published between 1937 and 1979, and the simulator that checks them is open, in your browser, and grades itself against those equations in public.
Objections and answers
The full inventory runs to more than forty objections and lives in a companion article. These are the twelve that matter most, each stated in its strongest form.
1. "The load calculation compares everyone to a mutation-free human who does not exist." Correct. Conceded in full above. The load argument does not prove decline. Everything in this article rests on fixation counts instead, which are unaffected by this objection because a fixed mutation is one that literally everyone carries — there is no relative comparison left to make.
2. "Selection is soft, not hard, so nobody needs 800 children." Also correct, and it dissolves the load paradox. It does not touch the ratchet. Soft selection decides who reproduces; it cannot remove a mutation that every candidate carries.
3. "Back mutation gives an equilibrium. There is no runaway." Correct, and calculated above. The equilibrium for weakly-selected sites is one where roughly half of them are wrong, and it takes on the order of 80 million generations to approach. The objection is true and irrelevant on any real timescale.
4. "Within the effectively-neutral zone, mutations are as likely to be beneficial as harmful, so drift has no direction." This is the strongest live objection, made by Stephen Schaffner of the Broad Institute among others, and it is Fisher's own geometric model rather than an ad-hoc rescue. Fisher's result guarantees an excess of harmful mutations at every effect size — but the excess shrinks toward an even split as the effect size falls, and it is exactly the small effects that matter here.
Measured distributions of fitness effects are skewed toward harm wherever they can be resolved. The honest limit is that they cannot be resolved anywhere near the range in question. The best precision ever achieved on a single selection coefficient is about 2 × 10⁻⁴, for three mutations in E. coli.125 A typical distribution study resolves effects above 4 × 10-3.126 The human drift barrier is 4 × 10⁻⁵. Nobody has measured the sign of a mutation in the zone the whole argument is about.
There is a second problem when an assay measures a molecular property, such as protein folding or fluorescence, rather than reproductive success. If the same nucleotide also contributes to a splice signal or a regulatory binding site, a change that improves the measured property may harm a function the assay cannot see. Montañez, Marks, Fernandez and Sanford model this concern: under their assumptions, the probability of a net beneficial change falls sharply as the number of overlapping codes increases.127 Their example assumes that 99.9% of positions are already optimal for each code, that the codes' preferred letters are chosen independently, and that equal beneficial and harmful effects cancel. Neither the number of codes affecting a typical nucleotide nor these fitness assumptions is measured by the model.
This is a reason to distinguish an improved molecular readout from improved overall fitness. It does not establish that every reported beneficial fraction is an upper bound on the true fraction. A competition or reproduction assay already combines the mutation's effects on success in the tested environment, including costs from overlapping functions that affect that success. It can still miss small effects and tradeoffs in other environments. Those limits must be assessed for each experiment, rather than imposed by the overlap calculation on all measurements.
5. "Compensatory and beneficial mutations offset the losses." This is the mainstream answer and it may well be right for fitness. Its weakness is that the required beneficial rate is assumed rather than measured, by the authors' own admission, and that compensation does not restore the specific sequences lost.
6. "Synergistic epistasis makes harmful mutations easier to remove together." Proposed by Kondrashov, Crow, and Eyre-Walker and Keightley. Sohail and colleagues reported evidence for it in humans and flies in 2017, though the effect they measured is small.128 Direct tests mostly fail to find it. Saber, Baer and colleagues ran C. elegans mutation-accumulation lines for two rounds of about 150 generations each and measured competitive fitness, the setting in which they expected synergy to be easiest to detect. Their result: "This study provides no support for the possibility that deleterious mutations interact synergistically," and the second round of mutations cost about half as much as the first, which points the other way.129 They name what rides on it, "the long-term existence of species with modest effective population sizes (e.g., humans, Kondrashov 1995 ...)," and say the idea has been "as influential among evolutionary geneticists as the supporting evidence for it is weak."129 A 2025 Drosophila inbreeding study, not yet peer reviewed, found synergy in one stage of the life cycle and the opposite in the next, adding up to a straight-line decline in offspring.130
Sanford's 2014 edition makes the same empirical point, citing Elena and Lenski's 1997 test in E. coli: "There is no reason to think that on a genomic level, the primary mode of interaction between mutations could involve synergistic epistasis."118 The same section overreaches when it says the mechanism "has all the appearance of representing deliberate obfuscation." That is a claim about motive, and nothing supports it. Synergy is an ordinary hypothesis, and it is being tested.
What this buys the argument is limited. The skeptic's reply is fair: one nematode experiment over 300 generations is a modest test, Saber's own group suspects fifty years of inconclusive results come from underpowered experiments, and Sohail's human signal is still on the other side. And a weak case for synergy does not revive the load argument, which fails for a different reason, the relative-fitness point conceded under Objection 1. What it removes is the escape Kondrashov himself thought most promising for his own paradox. Even if synergy were common, it reduces the load but it does not remove nearly-neutral mutations from the blind spot, because a mutation with an effect below 1/(2N_e) is invisible whether or not its effect is amplified by others — unless the amplification lifts it above the threshold, which is the empirical question.
7. "Bacteria and viruses have far higher mutation rates and are fine." Per genome, yes; per functional site, no. E. coli has a genomic deleterious rate on the order of 10-4 per generation, and the source is the same paper this article cites against itself on the load argument — Galeota-Sprung, Sniegowski and Ewens, who add the concession that matters here: "For many microbes, then, Haldane load theory may be appropriate."48 Humans are at 2 to 10. A microbe also produces enough offspring that a mutation-free one appears in every generation, which a mammal cannot do. This is exactly the T7 phage result above, and it argues that genetic entropy is a large-genome, low-fecundity problem specifically.
8. "Mutation accumulation lines recover when you put them back under selection." True — Estes and Lynch measured recovery three times faster than degradation. But recovery in those experiments comes largely from compensatory mutations and from selection against the strongly harmful mutations that dominate a fast-degrading MA line. It does not demonstrate the removal of the sub-threshold mutations at issue.
9. "Ancient DNA does not show the predicted decline." Partly true, and reported above. Genomic health improved from the deep past to the recent past. Any strong version of genetic entropy has to answer this.
10. "Fitness is relative and environment-dependent, so 'decline' is meaningless." This is a definitional move, not an argument. A protein-coding exon converted to non-coding DNA is a measurable loss whether or not you call it a fitness decline. The article's currency is fixed substitutions in constrained sequence, which is a count, not a value judgement.
11. "Your simulation ignores linkage, epistasis, changing environments, population structure..." It ignores linkage because including it makes the result worse, not better — the Full kernel in Drift Lab measures the difference and it runs in genetic entropy's favour. The other three are genuinely absent, and the honest statement is that changing environments in particular could cut either way.
12. "This is a creationist argument dressed up." The mechanism is Ohta's ratchet, named for Tomoko Ohta, and the fixation counts in this article agree to within 12–26% with a 2025 paper by a mainstream lab that concludes the population is fine. The disagreement is not about whether the ratchet turns. It is about whether the compensating process is large enough, and that is an empirical question with an unmeasured answer.
What this does and does not show
It does not show that the human genome is collapsing. Peter Keightley's group — the same Keightley who co-authored the 1999 paper the load literature rests on — ran the first replicated mutation-accumulation experiment in a mammal and extrapolated it: "We therefore predict a reduction in mean fitness from mutation accumulation of about 0.38% per generation in humans." Their own verdict on what that means: "it is doubtful whether a reduction in mean fitness due to mutation accumulation will be observable in human populations in the near future."131 Note the number is a hundred times larger than this article's, and note also that their measured fitness proxies "decrease on average by about 0.2% per generation, but with confidence intervals overlapping zero."131 That is the honest state of the empirical estimate: not zero, not well constrained, and not fast enough to notice.
At U = 5 the fitness cost of accumulated fixations computed here is about 0.0035% per generation — real, permanent, and far too small to notice in a lifetime. Kondrashov ran the same calculation with more conservative parameters in 1995 and got the same order of magnitude: with 100 mutations per genome, 10% of them very slightly deleterious at a mean selection coefficient of 10⁻⁶, "they cause the decline of fitness by ~10⁻⁵ per generation."3 Two independent routes, thirty years apart, land within a factor of four.
It does not show that evolution is impossible. It shows that a particular accounting has to balance, and that whether it balances depends on a beneficial mutation rate nobody has measured well.
It does not support the 6,000-year timescale on its own. Sanford's 2005 edition makes the case this way. At the current rate, 300 generations (6,000 years) would cost "about .003% of our total information," which the genome's robustness makes "conceivable"; 300,000 generations (6 million years) would cost 3%, and "This is inconceivable."132 His rate assumes "more than 600" mutations per person per generation, six to twelve times the 50 to 100 that Michael Lynch estimated in 2010 for all kinds of mutation together,104 and it counts every new mutation as lost information, a figure Sanford says "is not affected by what fraction of the genome is actually functional." With this article's numbers, about 1.1 harmful mutations fix per generation among roughly 220 million constrained letters, so 6 million years would fix about 0.15% of them, a rate about twenty times slower than Sanford's.133 Whether a genome can carry that is the unmeasured accounting question, not a settled one. In fitness terms, the 0.0035% per generation below, compounded over 300,000 generations, is Kondrashov's paradox, and the answer to it is the compensation argument rather than a smaller number. Either way the decline rate limits the timescale without fixing it.
What it does show is narrower than the popular version. Slightly harmful mutations fix permanently in large-genome sexual species, and their count is calculable: this article's figure and a mainstream lab's simulation agree to within 12–26%. Whether those fixations add up to degradation is disputed by Barton's school, which holds that polygenic traits compensate them. They also slow down: the equilibrium and the fitness feedback above both brake the decline, and at today's human population size the forward ratchet has nearly stopped. What remains is that the mainstream answer to the accounting question rests on a supply of beneficial mutations that its own advocates describe as uncertain. That is a genuine open problem in evolutionary genetics, and it is stated as such by the people who work on it.
And the open question this article ends on is not the one Kondrashov left open. His abstract closes off the exit that the current mainstream answer takes: "This paradox cannot be resolved by invoking beneficial mutations or environmental fluctuations."3
The abstract names two resolutions. The body names five, and anyone quoting only the abstract — as an earlier version of this article did — is giving an incomplete list:3
- The equilibrium is never reached, because species do not last long enough to arrive at it.
- N_e is higher than assumed. He rejects this: hybridization and horizontal transfer occur, but "it is highly unlikely that they are so important."
- The distribution of fitness effects is bimodal, with few sites in the dangerous range 10⁻⁹ < s < 10⁻⁵. "It is unclear why this should be the case."
- Synergistic epistasis.
- Soft selection.
Of the five, three have weakened since. Synergistic epistasis has found little support: the Masel lab's summary is that "the mean effects of two deleterious mutations are extraordinarily close to multiplicative,"42 and a 2026 test in C. elegans under competition found "no support" for synergy (Objection 6).129 Sohail's small 2017 signal in humans and flies is the main result on the other side. The bimodal-DFE option remains unmeasured and is still the best empirical hope for dissolving the whole problem — it is the same measurement gap named throughout this article, seen from the other side. Soft selection survives, and this article concedes it.
Option 1 is the one worth stopping on, because it is genetic entropy, proposed by the author of the paradox, in a mainstream journal, and not dismissed:
"the suggestion that accumulation of VSDMs in a lineage with N_e ≪ G acts as a time-bomb, finally destroying it, is a modification of this idea. If so, the existence of vertebrate lineages with N_e ≤ 10⁴–10⁵ should be limited to ~10⁶–10⁷ generations. Perhaps, this does not contradict the existing data."3
That is not an endorsement, and it should not be read as one. It is a working population geneticist saying that a finite lifespan for vertebrate lineages is consistent with what was known in 1995 — and 10⁶ to 10⁷ generations is tens of millions of years for a mammal, not thousands. It supports the mechanism and not the timescale. Nothing in this article gets closer to a mainstream statement of its own conclusion, and nothing in this article is further from a young-earth one.
Meanwhile the resolution now offered — a ratchet balanced by rarer beneficial fixations of larger effect — is the one Kondrashov ruled out by name, and it is offered without the measurement that would settle whether he was wrong to rule it out.
That is the honest end state. Kondrashov may simply have been mistaken about beneficial mutations; the Masel group thinks so and has a model that says so. But their own paper says "there is great uncertainty in the true values of U_b and s̄_b," and until somebody measures the mean effect of the beneficial mutations available to a well-adapted large genome, the answer rests on an assumed parameter rather than a measured one. That is a real open problem in evolutionary genetics, and it is stated as such by the people who work on it.
One last limit on the scope of all this, because the version a reader is likely to have met elsewhere is narrower and worse. Genetic entropy is sometimes defended as a claim about "large multicellular eukaryotes" only, with bacteria and viruses excluded when they fail to cooperate. That retreat makes the thesis unfalsifiable in exactly the systems where it can be tested in a human lifetime. This article does not take it. Sanford's own 2014 statement of the scope is better than that retreat. He argues that most microbes resist genetic entropy because "in microbial systems there is selection after every cell division. So there are about 1,000 cycles of selection for every mutation that occurs. In man it is reversed – there is only 1 cycle of selection for every 100 mutations."118 That is the same per-generation arithmetic as Objection 7, and it is sound. The weak step comes next. For RNA viruses he says mutational meltdown "is well documented," which overstates the lethal-mutagenesis record described above, and he explains their survival by strains that sit dormant and "re-emerge from 'natural reservoirs'," an explanation he offers without data on any lineage.118 The argument here is a function of two measurable quantities — the genome-wide deleterious mutation rate and the effective population size — and it predicts what it predicts in any organism, including the ones where the prediction comes out weak. In E. coli it comes out weak, and this article says so.
Going deeper
- Objections and answers — thirty-four objections, each stated in its strongest form, with a response and a verdict of Fatal, Serious, Partial, Weak or Confused. Six are Fatal.
- The experimental record — mutation accumulation lines, lethal mutagenesis, mutator strains and the human data, including every result that cuts the other way.
- Simulating genetic entropy — Mendel's Accountant honestly assessed, the mainstream alternatives, and why this article does not use any of them.
- What has actually been measured about mutations — the distribution of fitness effects, catalogued. Which numbers are measurements and which are model outputs, what the instruments can and cannot resolve, and why "beneficial" in this literature usually means something was destroyed.
- The literature — every source this argument touches, tagged by topic, camp, and which way it cuts. Filter for undercuts to read the strongest material against this article.
- Sanford's Genetic Entropy, audited — the book that made this argument famous, checked page by page against the primary sources. Seven documented errors, and what four editions across nine years did and did not fix.
Test it yourself
- Drift Lab — the simulator used for every figure here. Change the parameters, run it, read the code, and run the self-tests against Kimura, Watterson and Haldane in front of you.
- Functional DNA is Evidence of Design — the companion argument for a high functional fraction, which is what sets U.
Sources
- 1.
Crow, James F. “The high spontaneous mutation rate: Is it a health risk?” PNAS. Aug 5, 1997. “Since most mutations, if they have any effect at all, are harmful, the overall impact of the mutation process must be deleterious.” A paper that asks whether the high spontaneous mutation rate is a health risk. The article reads its answer as yes, and cites it for the claim that most mutations are harmful and for the formula giving the fraction of people who fail to reproduce. ↩ ↩
- 1a.
“I believe that, although strict truncation is totally unrealistic, quasi-truncation selection is reasonable.” ↩
- 1a.
- 2.
Matheson, Joseph et al. “Human deleterious mutation rate slows adaptation and implies high fitness variance.” bioRxiv. Mar 25, 2025. “Each new human has an expected U_d = 2-10 new deleterious mutations.” A preprint, not yet peer reviewed, that simulates the harmful mutations each new person carries. The authors estimate an expected 2 to 10 new deleterious mutations per person. Using genome-wide simulations, they find that the fitness decline from many slightly harmful fixations (mutations that spread through the whole population) is compensated by rarer beneficial mutations of larger effect. Version 1 was posted in September 2023 under a different title. Funded by the John Templeton Foundation and NIH grant GM084905. The article uses it for the claim that Ohta's ratchet is real and that the population survives because beneficial fixations balance it. ↩ ↩ ↩
- 2a.
“56,255 deleterious and 6,387 beneficial fixations occurred over the 200,000 generations simulated for Figure 2.” ↩
- 2b.
“We confirmed that U_d > 1 need not cause population decline, because the accumulation of mildly deleterious fixations (Ohta's ratchet) is countered by a smaller number of larger-effect beneficial fixations under quite conservative assumptions.” ↩
- 2c.
“While there is great uncertainty in the true values of U_b and s̄_b, the s̄_b > ~0.001 − 0.003 range required for population persistence seems entirely plausible.” ↩ ↩
- 2d.
“In the representative case shown in Figure 2, fixations have s̄_b = 0.00423... and s̄_d = −0.0000391 (almost three orders of magnitude smaller than the mean of −0.009 for de novo deleterious mutations).” ↩ ↩
- 2e.
“This produced Ne ~7500, on the order of effective population sizes inferred for ancestral human populations.” ↩
- 2f.
“many proteins accumulate small deleterious mutations that slightly inhibit folding, which can be compensated for by a novel or improved or overexpressed chaperone protein.” ↩
- 2g.
“populations with increased mutation rates took only 127 generations to increase their fitness by 10%, compared to 151 generations for the baseline population.” The baseline is their reference case, U_b = 0.002 and s̄_b = 0.0025. ↩
- 2h.
“The mean beneficial effect size s̄_b is more important than the beneficial mutation rate U_b for achieving net positive fitness flux.” ↩
- 2i.
Lines 100–106: “a gamma distribution for 2N_e s_h with mean −224.33, shape parameter α = 0.169 and scale parameter β = 1327.4. After drawing a value of 2N_e s_h from this distribution, we rescale to s_h using their inferred N_e = 11,823. We use the s_h value drawn from this distribution as our s_d value; its mean is 0.009,”. For the beneficial side: “(again, this is the fitness effect in the heterozygote).” ↩
- 2a.
- 3.
Kondrashov, Alexey S. “Contamination of the genome by very slightly deleterious mutations: why have we not died 100 times over?” Journal of Theoretical Biology 175:583–594. Aug 21, 1995. Page 583: “If substitutions at 10% of all nucleotide sites have selection coefficients within this range with the mean 10⁻⁶, an average individual carries approximately 100 lethal equivalents.” A 1995 theory paper by Alexey Kondrashov of Cornell University. It argues that very slightly harmful mutations, too weak for selection to remove reliably, would pile up across the genome and leave the average person carrying about 100 lethal equivalents (units of harm, each equal to one lethal mutation). The article uses it as a foundational statement of the load problem and quotes the author's own admissions from it. ↩ ↩
- 3a.
Page 583: “This paradox cannot be resolved by invoking beneficial mutations or environmental fluctuations. Several possible resolutions are considered, including soft selection and synergistic epistasis among very slightly deleterious mutations.” From the abstract, both sentences. The first sentence was omitted from an earlier version of this article; it matters, because it excludes the resolution the current mainstream answer relies on. ↩
- 3b.
Page 589, section Is the stochastic mutation load paradox real?: The Kimura position he rejects, that rare beneficial fixations counterbalance the accumulating deleterious ones, is structurally the same as the resolution offered by Matheson and colleagues in 2025, though neither paper cites the other on this point. ↩
- 3c.
Page 589: “Very slightly beneficial mutations are part of our analysis: they appear when VSDMs are frequent and prevent them from fixation, while changes of the environment, either in time or in space, can only add a component to the genetic load (lag-load or migration load, respectively, see Crow, 1970; Stenseth & Maynard Smith, 1982). Thus, the load is minimal when, as it was assumed here, the selection remains invariant in time and space for a long time, so that all significantly beneficial mutation are already fixed.” ↩
- 3d.
Page 589: “It is unclear how natural populations can avoid this. One possibility is that after some deviation from the optimum each next mutation becomes very deleterious (synergistic epistasis, see below). Anyway, the assumption that there is an equilibrium contamination can only underestimate the impact of VSDMs.” The first sentence of that passage is also the clearest statement anywhere that the problem was unresolved in 1995. ↩
- 3e.
Page 590: This is the lag-load-versus-lead distinction that the Masel lab now presses, conceded by Kondrashov in the same paragraph in which he keeps the contamination claim. ↩
- 3f.
Page 589: “The total mutation rate in mammals is ~100 events per genome. If 10% of them are VSDMs with the average selection coefficient 10−6 (implying N_e ≈ 105), they cause the decline of fitness by ~10−5 per generation (if initially all nucleotides were best). This decline will become important ~105 generations after the drop of N_e.” Note the parenthesis: his figure is an upper bound conditional on the genome starting optimal, which is the assumption this article's objection 4 says cannot be granted for free. ↩
- 3g.
Page 590, section Possible resolutions and implications of the paradox: “Because the stochastic mutation load paradox appears real, it requires a resolution. Five options must be mentioned.” The five are summarised in the text above; options (ii) and (iii) are quoted there verbatim. The paper's abstract lists only soft selection and synergistic epistasis, so quoting the abstract alone understates the range he considered. ↩
- 3h.
Page 590: Option (i), following Crow 1972 and Chetverikov 1926. Emphasis added. The full passage follows. “First, the properties of equilibrium may be irrelevant, because it is never reached (Crow, 1972). Chetverikov (1926, Result 7) assumed that the mutational contamination of a species increases with time, leading, perhaps, to its eventual extinction. In reality, of course, there is no reason why a new species should have a fresh start.” G is genome size in nucleotides and N_e the effective population size, so N_e ≪ G is the condition this article calls the drift barrier being wide. ↩
- 3a.
- 4.
Kong, Augustine et al. “Rate of de novo mutations and the importance of father's age to disease risk.” Nature 488(7412):471–475. Aug 23, 2012. “a total of 4,933 de novo mutations, or an average of 63.2 per trio, were called”. “an increase of about 2 mutations per year.” A 2012 study that sequenced the whole genomes of 78 Icelandic trios (a mother, a father and a child) at high coverage and counted the new mutations in each child, at an average father's age of 29.7. It found that the father's age explains nearly all of the variation left after random noise is allowed for, with about 2 more mutations per year of his age. The article uses it for the direct count of new mutations in each child and for the effect of the father's age. ↩ ↩
- 5.
Jónsson, Hákon et al. “Parental influence on human germline de novo mutations in 1,548 trios from Iceland.” Nature. Sep 28, 2017. “We find 108,778 de novo mutations”. A 2017 study that counts the new mutations in children from 1,548 Icelandic trios (a mother, a father and a child) and asks how the parents' ages affect them. It finds about 70 new mutations per proband, with maternal mutations rising 0.37 per year of age against 1.51 per year from fathers. The article uses it as the larger follow-up that confirmed the 2012 finding about fathers' age and the count of new mutations. ↩ ↩
- 6.
Keightley, Peter D. “Rates and Fitness Consequences of New Mutations in Humans.” Genetics 190(2):295–304. Feb 2012. “estimates are U ≈ 2.2 for the whole diploid genome per generation and ~0.35 for mutations that change an amino acid.” That implies a mean selective constraint of only about 3.1% per site. A review of how many new mutations arise in each person per generation and how much harm they do. Its questions include how many new variants each of us carries that our parents did not have, and how the mutation rate changes with parental age. The article uses it as the low end of the estimates for U, the number of harmful mutations per diploid genome (a person's full set of chromosomes) per generation. ↩ ↩
- 7.
Barton, Nicholas H. “The "New Synthesis".” PNAS 119(30):e2122147119. Jul 18, 2022. A review article in PNAS by Nicholas Barton of the Institute of Science and Technology Austria, on what the "New Synthesis" of Mendel and Darwin still leaves unexplained. Barton is among the most senior living theoretical population geneticists. The passage the article quotes relies on Lynch's 2007 book The Origins of Genome Architecture (reference 21) and Kondrashov's 1995 paper (reference 55). The article uses it because it is the clearest statement in the mainstream literature that the drift-barrier framing is the wrong way to think about adaptation, and the article treats it as the strongest objection to its own argument. ↩
- 8.
Porubsky, David et al. “Human de novo mutation rates from a four-generation pedigree reference.” Nature 643(8071):427–436. 2025. A long-read sequencing study of one four-generation family (CEPH 1463) that counted the new genetic changes passed from parent to child. Per transmission it counted 74.5 de novo single-nucleotide variants, 7.4 non-tandem-repeat indels, 65.3 tandem-repeat indels and structural variants, and 4.4 centromeric events, 98 to 206 in total and averaging about 152. The deleterious fraction of the repeat-length changes is unmeasured. The article uses its average of about 152 new changes per generation, and its warning that most of the increase is repeat-length change. ↩
- 9.
Moran, Laurence A. “Human mutation rates - what's the right number?” Sandwalk. Apr 2015. He restates the 100 figure in A new higher mutation rate in humans (May 2025), commenting on the same long-read study this article cites, and independently flags the same caveat about the tandem-repeat component being software-dependent. A blog post, not peer reviewed, in which Moran works out the human mutation rate by three routes: biochemical (130), phylogenetic (112-160), and direct sequencing, which he regards as an underestimate. He settles on 100 as his working figure, and the article uses it to show that its own figure is lower, so every number in the article would be larger on Moran's figure. ↩
- 10.
Eyre-Walker, Adam, and Peter D. Keightley. “The distribution of fitness effects of new mutations.” Nature Reviews Genetics 8:610–618. Aug 2007. “advantageous mutations are rare, and those that are strongly selected are exponentially distributed; and the DFE of deleterious mutations is complex and multi-modal.” A review of the distribution of fitness effects of new mutations, drawing on mutation accumulation experiments and DNA sequence data across species. Its abstract describes the deleterious tail as complex and multi-modal, which sits awkwardly with one fixed shape. The article cites it alongside other studies for the claim that the distribution has the same shape in every species. ↩
- 11.
Boyko, Adam R. et al. “Assessing the evolutionary impact of amino acid mutations in the human genome.” PLoS Genetics 4(5):e1000083. May 30, 2008. “27–29% of amino acid changing (nonsynonymous) mutations are neutral or nearly neutral, 30–42% are moderately deleterious, and nearly all the remainder are highly deleterious or lethal.” A population-genetics study that sequenced 11,404 human protein-coding genes in 35 people and inferred how strongly new amino-acid-changing mutations are selected against. It infers the effects from patterns of variation in people, not by measuring mutations directly. Its gamma fit gives shape α = 0.184, and the article cites it for the claim that the fitness-effect distribution has the same shape in every species measured. ↩
- 12.
Kim, Bernard Y. et al. “Inference of the Distribution of Selection Coefficients for New Nonsynonymous Mutations Using Large Samples.” Genetics. May 2017. “We infer significantly fewer (0.38–0.84 fold) strongly deleterious mutations with selection coefficient |s| > 0.01 and more (1.24–1.43 fold) weakly deleterious mutations with selection coefficient |s| < 0.001 compared to previous estimates.” Gamma shape 0.169–0.215. A 2017 study that estimates how strongly new mutations that change an amino acid (nonsynonymous mutations) harm fitness, using large samples. It finds fewer strongly harmful mutations and more weakly harmful ones than earlier estimates, and it fits the spread of harm to a gamma distribution, a curve set by a shape parameter. The article uses it as the recent measurement behind its shape parameter of about 0.2. ↩
- 12a.
Page 351, right column: “We infer a strongly leptokurtic distribution where there are many neutral and nearly neutral mutations (i.e., 34–37% of new mutations have |s| < 10⁻⁴), as well as a class of strongly deleterious mutations (i.e., 15–22% of new mutations have |s| > 10⁻²).” Page 354, table 3: At the authors' preferred mutation rate, the share of new amino-acid mutations below |s| = 10⁻⁵ is 0.237, 0.263 and 0.242 in their three data sets. ↩
- 12a.
- 13.
Böndel, Katharina B. et al. “Inferring the distribution of fitness effects of spontaneous mutations in Chlamydomonas reinhardtii.” PLoS Biology. Jun 26, 2019. “Of mutations with absolute fitness effects exceeding 1%, about one-sixth increase fitness in the laboratory environment.” Their two-sided gamma fit gives a shape of 0.30, mean effects of −0.0092 and +0.0021, and a positive-effect frequency of 0.84 (95% CrI 0.73–0.90). The authors distrust that last number themselves: at a 1% threshold. “there are about six times more negative- than positive-effect mutations exceeding this value.” And: “many mutations have a very small effect (we do not know whether their effects are positive or negative).” A laboratory study of spontaneous mutations in the green alga Chlamydomonas reinhardtii, fitting a distribution to how much each mutation changed fitness. The article uses it to show that the fitted share of beneficial mutations depends on the model, since the authors say they cannot tell whether many small effects are positive or negative. ↩ ↩ ↩
- 14.
Kimura, Motoo. “Model of effectively neutral mutations in which selective constraint is incorporated.” PNAS 76(7):3440–3444. Jul 1979. “Under the present model, effectively neutral, but, in fact, very slightly deleterious mutants accumulate continuously in every species.” His own proposed fix, occasional adaptive substitutions, "will easily take care of" it, is asserted, not modelled. A 1979 theory paper that builds a model in which the harm done by each mutation varies from site to site, following a gamma distribution with a shape parameter (β). Kimura calls mutations "effectively neutral" when their selection coefficient lies between 0 and 1/(2N_e). The paper sets aside beneficial mutations, which Kimura admits is an oversimplification. The article uses it because Kimura himself described the problem of barely harmful mutations in 1979, and because its Figure 1 caption marks the drift boundary the article relies on. Mirror: PMC ↩
- 14a.
“even if the frequency of strictly neutral mutations (for which s' = 0) is zero in the present model, a large fraction of mutations can be effectively neutral if β is small.” ↩
- 14b.
Figure 1, page 3441: “FIG. 1. Frequency distribution of selection coefficients among mutants at different sites within a cistron (gene). The shaded area represents the fraction of effectively neutral mutations. Parameter values assumed are β = 0.5 and s̄' = 0.001. For details, see text.” The horizontal axis is labelled "Selective disadvantage" and spans 0 to 2 × 10⁻³, so the whole distribution is on the harmful side. The shaded region is bounded at 1/2N_e, marked on the axis, which is the drift barrier this article uses throughout. Kimura's own shape parameter is β = 0.5, whereas modern fits to measured data cluster nearer 0.2, implying an even longer tail of barely-harmful mutations than he assumed. ↩ ↩
- 14c.
Page 3444, left column, last paragraph: “Finally, there is one biological problem that we have to consider. Under the present model, effectively neutral, but, in fact, very slightly deleterious mutants accumulate continuously in every species. The selective disadvantage of such mutants (in terms of an individual's survival and reproduction—i.e., in Darwinian fitness) is likely to be of the order of 10⁻⁵ or less, but with 10⁴ loci per genome coding for various proteins and each accumulating the mutants at the rate of 10⁻⁶ per generation, the rate of loss of fitness per generation may amount to 10⁻⁷ per generation. Whether such a small rate of deterioration in fitness constitutes a threat to the survival and welfare of the species (not to the individual) is a moot point, but this will easily be taken care of by adaptive gene substitutions that must occur from time to time (say once every few hundred generations).” Kimura's 10⁻⁷ assumes only protein-coding loci. This article's U = 5 counts constrained noncoding sequence as well, which is why its rate of 0.0035% per generation is about 350 times his. ↩
- 14a.
- 15.
Felsenstein, Joseph. Theoretical Evolutionary Genetics. University of Washington. 2003. Page 120, section The c paradox and mutational load. Felsenstein's own course textbook, free online and still on the University of Washington site. He is a member of the National Academy of Sciences and one of this argument's most persistent critics, so his textbook statement of the argument carries more weight than any creationist source could. The article uses it because he works out the load numbers in the standard textbook and then lists the ways out. Mirror: Archive.org ↩
- 15a.
Page 120: “If there were 20 million genes, each subject to mutation at a rate 10−7 to deleterious alleles, the fitness of the population would be reduced to e−2 ≃ 0.15 of its potential value… Clearly an organism with as much DNA as we have would be in severe trouble. Yet in humans well over 98% of all newborns survive to adulthood in most industrial countries.” ↩
- 15b.
Page 120: On the second resolution: “It may be that in nominally increasing the load, organisms have at the same time increased the upper limit of their fitness (perhaps by increasing their reproductive excess) more than enough to compensate… The difficulty with accepting this view is that it seems to predict that as more loci enter the genome the discrepancy between maximum possible fitness and average fitness increases. This is hard to reconcile with the high viability of humans in industrial countries.” On the third: “An alternative solution is to suggest that each selective death kills many mutant genes, so that one needs fewer selective deaths to balance the number of mutations… Models of selection of this sort were introduced by Sved, Reed, and Bodmer (1967), King (1967), and Milkman (1967).” ↩
- 15c.
Immediately before the c-paradox section, on soft selection and density dependence, he wrote: “the reduction of the number of surviving offspring from 1000 to 500 will probably have only a small effect on the number of adults maintained in the population, since it will still be pressing against the limits set by density-dependence. It would be a mistake to conclude from this that the mutational load has no effect whatsoever on population dynamics.” ↩
- 15a.
- 16.
Moran, Larry. “Revisiting the genetic load argument with Dan Graur.” Sandwalk. Jul 2017. In the post's own note paragraph, Moran writes: “there are bulk DNA hypotheses that attribute non-sequence specific function to most of the genome and if they are correct the genetic load argument carries no weight. So far, there is no good evidence that these bulk DNA hypotheses are valid and most objections to junk DNA are based on sequence-specific functions.” A blog post by Larry Moran, a biochemist who writes the Sandwalk blog, explaining the genetic load argument for junk DNA with Dan Graur's 2017 paper as the worked example. On the post's figures, only about 10% of the genome could be functional. The article uses it because the post admits that the load argument applies only to DNA whose exact sequence matters, so the argument has to show sequence-specific function, not function of any kind. ↩
- 17.
Lindblad-Toh, Kerstin et al. “A high-resolution map of human evolutionary constraint using 29 mammals.” Nature. Oct 2011. “at least 5.5% of the human genome has undergone purifying selection,”. “constrained elements covering ~4.2% of the genome.” A genome comparison of 29 mammals that maps human evolutionary constraint, the parts of the genome that natural selection keeps from changing. The article uses its figures for how much of the human genome is under purifying selection, which is selection that removes harmful changes. ↩
- 18.
Meader, Stephen et al. “Massive turnover of functional sequence in human and other mammalian genomes.” Genome Research 20(10):1335–1343. Oct 2010. “between 200 and 300 Mb (~6.5%–10%) of the human genome is under functional constraint.” A genome comparison of pairs of eutherian (placental) mammal genomes that identified sequence constrained by insertions and deletions, and estimated how much of the human genome is under functional constraint. The estimate was made from insertions and deletions rather than substitutions. The article cites it in its table of estimates, for the insertion and deletion method at 6.5% to 10%. ↩
- 19.
Rands, Chris M. et al. “8.2% of the Human Genome Is Constrained: Variation in Rates of Turnover across Functional Element Classes in the Human Lineage.” PLoS Genetics 10(7):e1004525. Jul 24, 2014. The paper also reports: “8.2% (7.1–9.2%) of the human genome is presently subject to negative selection and thus is likely to be functional.” Deep alignments systematically undercount the shared constraint, so this figure is low. “only 2.2% has maintained constraint in both human and mouse”. A genome comparison across functional element classes in the human lineage, which extrapolated the share of the genome that is under negative selection (selection that removes harmful changes). The article uses its turnover-corrected figure of 8.2% (7.1–9.2%) as the constrained share of the genome. ↩
- 20.
Christmas, Matthew J. et al. “Evolutionary constraint and innovation across hundreds of placental mammals.” Science. Apr 28, 2023. “At least 332 million bases (~10.7%) in the human genome are unusually conserved across species (evolutionarily constrained) relative to neutrally evolving repeats.” The 10.7% is element-level. Section Single-base resolution of constraint: “We defined a 'constrained base' as a position that has a positive phyloP score with FDR < 5%. Constrained bases comprise 3.26% (101 Mb) of the human genome.” The article's own arithmetic, not the paper's: with about 68 new mutations per birth, 3.26% gives U ≈ 2.25 and 10.7% gives U ≈ 7.3. A comparative-genomics study of constraint, meaning DNA that has changed less across species than neutral DNA would, across hundreds of placental mammals (the Zoonomia project). The article uses its two figures, 10.7% of the human genome in constrained elements and 3.26% of single bases, to bracket its estimate of U, because the two figures measure different things. ↩ ↩
- 21.
Kellis, Manolis et al. “Defining functional DNA elements in the human genome.” PNAS 111(17):6131–6138. Apr 29, 2014. “each suggests roughly two to three times more constraint than previously (12–15%),”. “an additional 4–11% of the genome may be under lineage-specific constraint after specifically excluding protein-coding regions.” A 2014 review by ENCODE scientists that weighs the genetic, evolutionary and biochemical evidence for which parts of the human genome are functional, and examines where the evidence disagrees. Its newer constraint estimates are quoted below. The article uses it as the ENCODE leadership's own estimate of constraint, 12–15% plus 4–11% for lineage-specific constraint. ↩
- 22.
Dukler, Noah et al. “Extreme purifying selection against point mutations in the human genome.” Nature Communications 13. Jul 25, 2022. “We estimate that ~0.4–0.7% of the human genome is ultraselected, implying ~0.26–0.51 strongly deleterious mutations per generation.” A method paper that estimates how much of the human genome is under extreme purifying selection, where any point mutation is assumed to be strongly deleterious. The method, ExtRaINSIGHT, covers noncoding DNA as well as coding DNA. From 71,702 gnomAD v3 whole genomes. The article uses it as the honest floor for strongly harmful mutations, since the method is designed not to detect the weaker mutations the argument depends on. ↩ ↩
- 23.
Lesecque, Yann et al. “A Resolution of the Mutation Load Paradox in Humans.” Genetics 191:1321–1330. Aug 2012. “Our conservative estimate of U = 2.1, which includes mutations in coding and noncoding DNA, predicts that f = 1 − e^−2.1 = 88% if mutations act independently.” A 2012 theory paper that models selection through relative fitness, meaning competition between individuals, rather than measuring harm against a mutation-free genotype. It finds that the share of people who fail to reproduce is much smaller than the classic formula predicts, so a species could tolerate many new harmful mutations per genome each generation. The article uses it for that formal resolution of the load paradox and for its estimate of U = 2.1. ↩
- 23a.
“females breastfeed their offspring for several years; this suppresses ovulation and leads to an average interbirth interval of approximately 3 years... Since hunter–gatherer females typically reach menarche at 16 years and menopause at 47 years... they have the potential to produce only 11.” ↩
- 23b.
Page 1321: “a species could tolerate 10's or even 100's of new deleterious mutations per genome each generation.” ↩
- 23a.
- 24.
Graur, Dan. “An Upper Limit on the Functional Fraction of the Human Genome.” Genome Biology and Evolution 9(7):1880–1885. Jul 2017. Page 1880: “Mutational load considerations lead to the conclusion that the functional fraction within the human genome cannot exceed 15%.” At ENCODE's 80% he computes 102 children per couple. Both figures come from his Table 1, which uses e2U where eU belongs; corrected, the ceiling at his most permissive rate (4 × 10⁻¹⁰ deleterious mutations per site per generation) moves from 14.2% to 28.3%, and the ENCODE figure from 102 children per couple to about 14. A 2019 corrigendum corrects these numbers. A 2017 theory paper by Dan Graur of the University of Houston that uses the mutation load (the drag that harmful mutations put on average fitness) to set an upper limit on how much of the human genome can be functional. Its method asks how much function the mutation load can tolerate. The article uses it because Graur works the same arithmetic in the opposite direction and reaches the same place. ↩
- 25.
Graur, Dan. “Corrigendum to: An Upper Limit on the Functional Fraction of the Human Genome.” Genome Biology and Evolution 11(11):3158. 2019. Page 3158: “The addition of the factor 2 to equation (3) affects numerical values throughout the article, which have also been corrected.” Table 1: The reprinted Table 1 is identical to the 2017 Table 1 in every cell (for example, both give 51 at 80% functional and 4 × 10⁻¹⁰, and 2.1 at 15%). A cell check shows the table is e2U with U = μ × fraction × 6.114 × 10⁹, his diploid genome size: at 5% and 10−9, eU = 1.36 while the table prints 1.8 = e2U. Solving eU = 2 at 4 × 10⁻¹⁰ gives a functional fraction of 28.3%; solving e2U = 2 gives his 14.2%. A 2019 correction to the 2017 paper. It adds a factor of 2 that was left out of the mutation-load equation and reprints Table 1 with the corrected values. The article uses it because the correction fixes a factor-of-two slip in the 2017 table, and the correction helps ENCODE. ↩
- 26.
Johri, Parul et al. “Developing an Evolutionary Baseline Model for Humans: Jointly Inferring Purifying Selection with Population History.” Molecular Biology and Evolution 40(5):msad100. 2023. A joint inference of population history and purifying selection using 465 human exons and linked sequence. Adding specified rare beneficial classes produced almost unchanged summary statistics, while common strong positive selection fitted poorly. These tests show an identification problem for those data and models, rather than a limit proved for every method. ↩
- 26a.
Section Evaluating the Identifiability of a Beneficial Mutational Class: “there is almost no difference between the distribution of statistics across the 465 exons in the absence versus presence of positive selection”. This result concerns beneficial fractions of 0.1% or 1% and mean homozygote effects scaled as 2Ne sb = 10 or 100, with semidominance assumed. The authors compare it with a Drosophila result and propose testing future inference methods that explicitly include beneficial mutations. ↩
- 26b.
Section Abstract: “although strong and/or frequent recurrent positive selection is inconsistent with observed data, weak to moderate positive selection is consistent but unidentifiable if rare.” ↩
- 26a.
- 27.
Soni, Vivak et al. “The effects of mutation and recombination rate heterogeneity on the inference of demography and the distribution of fitness effects.” Genome Biology and Evolution 16(2):evae004. 2024. A study of how variation in mutation and recombination rates affects inferences about population history and the distribution of fitness effects. Jeffrey Jensen, a co-author of the Johri paper this article quotes, is also on this one, so the same group documents the limits of the methods it uses. The article cites it against its own convenience, because the bias it finds, toward inferring more effectively neutral mutations than are really there, flatters the argument made here. ↩
- 27a.
DFE-alpha is among the most widely used tools for inferring distributions of fitness effects from polymorphism data, and several of the constrained-fraction and DFE estimates this article relies on were produced with it or with close relatives of it. ↩
- 27a.
- 28.
Palazzo, Alexander F., and T. Ryan Gregory. “The case for junk DNA.” PLoS Genetics 10(5):e1004351. May 2014. Both authors are prominent advocates of the junk-DNA position, so this passage carries more weight than a creationist statement of the same arithmetic. Its three figures, the meltdown mechanism, the roughly one-per-generation ceiling and the observed 2.1-10, appear within a few sentences of each other. The article uses it because the authors reach their conclusion that at most 1% of the nucleotides in the genome are essential from that same load ceiling. ↩
- 28a.
This is the inference that makes the article's point: the load argument is used to bound the functional fraction, so the ceiling and the junk-DNA conclusion are the same claim. Whoever escapes the load paradox by relative fitness (as this article does, and as Lesecque, Charlesworth and Galeota-Sprung do) has given up the premise the 1% is derived from. ↩
- 28a.
- 29.
Moran, Laurence A. “A creationist tries to understand genetic load.” Sandwalk. Apr 1, 2014. “Sal Cordova is correct that if the deleterious mutation rate is too high, the species will go extinct. We don't know the exact minimum number of deleterious mutations that have to happen per generation in order to cause a problem. It's probably less than two (2). It's probably not as low as 0.5. It should be no more than 1 or 2 deleterious mutations per generation.” A blog post, not peer reviewed, answering the creationist Sal Cordova. The article quotes it for the ceiling its author asserts, not as an authority for that ceiling. The article uses it because Moran makes the load argument less formally, putting the tolerable rate at no more than 1 or 2 deleterious mutations per generation. ↩
- 29a.
From Moran's comment of 17 July 2017 under "Revisiting the genetic load argument with Dan Graur," Sandwalk, Jul 14, 2017: “If there are 100 new mutations per genome and 4% are deleterious then this means that each individual in each generation will acquire 4 deleterious mutations. That's an intolerable genetic load; it suggests that most of our genome is not a target (i.e. not functional).” The inference runs from the load formula to the junk-DNA conclusion, which is the circularity named in objections. ↩
- 29a.
- 30.
Ohta, Tomoko. “The nearly neutral theory of molecular evolution.” Annual Review of Ecology and Systematics 23:263–286. 1992. Page 270: “the fixation probability is a continuous monotone function of Ns.” Page 272: “I propose that a substantial fraction of mutant substitutions at the molecular level are caused by random fixation of very slightly deleterious mutations.” A review by Tomoko Ohta, who originated the nearly neutral theory, from the National Institute of Genetics in Japan. The process this article calls Ohta's ratchet is hers. The article uses her review to show that selection near the boundary of neutrality is weak, not absent. ↩
- 30a.
Page 272: On compensation: “Molecular variants that disturb very slightly the secondary structure of molecules, e.g. by opening the stem region of a clover leaf structure of tRNA, may represent a mutant class with mild deleterious effects. In this case, it is likely that a slightly deleterious base substitution is followed by a slightly advantageous (compensatory) substitution. This is supported by the observation that G.U or U.G pairs that represent intermediate steps account for about two thirds of all non-Watson-Crick pairs in the helical regions of analyzed tRNAs.” ↩
- 30a.
- 31.
Felsenstein, Joe. “Comment in 'Kondrashov's Paradox: Why We Haven't Died 100 Times Over'.” Peaceful Science. Jun 28, 2026. A discussion-board comment, a forum post that is not peer-reviewed. Felsenstein is emeritus professor at the University of Washington and the author of Inferring Phylogenies, and the 1971 calculation he refers to is his own. The article uses his comment because it is the sharpest objection to the effective population size (Ne) figure the article relies on, and because he is better placed than anyone else in the exchange to make it. ↩
- 32.
Nachman, Michael W., and Susan L. Crowell. “Estimate of the mutation rate per nucleotide in humans.” Genetics 156(1):297–304. Sep 2000. “For U = 3, the average fitness is reduced to 0.05, or put differently, each female would need to produce 40 offspring for 2 to survive and maintain the population at constant size.” A comparison of human and chimpanzee pseudogenes (copies of genes that no longer work) to estimate the average mutation rate per nucleotide. The paper gives about 2.5 x 10^-8 mutations per nucleotide site, or 175 mutations per diploid genome per generation. Their 175 mutations per genome is about 2.4 times the modern pedigree figure, so their U ≈ 3 is correspondingly inflated. The article uses it for U = 3, where each female would need to produce 40 offspring for 2 to survive. ↩ ↩
- 33.
Muller, Hermann J. “Our load of mutations.” American Journal of Human Genetics 2(2):111–176. Jun 1950. “equilibrium could not be maintained, and the genetic composition would deteriorate continuously, while the population would meanwhile diminish in numbers all the way to the point of disappearance.” A 1950 article by H. J. Muller of Indiana University, based on his presidential address to the American Society of Human Genetics in 1949. It argues that mutation causes impairment of human functions far more often than the prevailing view held, and it estimates how often such disorders occur from an equilibrium argument, in which new mutant cases are balanced by their removal through selection. The article uses it as the first statement of the load problem, since Muller raised it in 1950. ↩
- 34.
Eyre-Walker, Adam, and Peter D. Keightley. “High genomic deleterious mutation rates in hominids.” Nature 397:344–347. Jan 28, 1999. “it is doubtful that such species, which have low reproductive rates, could survive if mutational effects on fitness were to combine in a multiplicative way.” A 1999 paper that estimated the rate of deleterious mutations in hominids, the family that includes humans. The article cites it for the finding that the rate in coding DNA alone is close to the upper limit a population can tolerate. Mirror: PubMed ↩
- 35.
Crow, James F., and Motoo Kimura. “Efficiency of truncation selection.” PNAS, 396–399. Jan 1979. Page 398: “the relative efficiency of truncation selection ranges from 5 to 20”. Their scenario culls 10% of the population, which is Haldane's own budget, so their claim is that truncation lets a low-fecundity species pay a load that the multiplicative arithmetic says it cannot. A study by James Crow and Motoo Kimura of how much better truncation selection works than selecting against each harmful mutation on its own. Truncation selection removes every individual below a fitness cutoff, and the paper measures the gain for a fruit fly (Drosophila) case. The article uses it for the point that truncation makes harmful mutations cheap to remove, with a gain of 5 to 20 times. ↩
- 36.
Felsenstein, Joe. “Comment on 'Evolution Visualized'.” The Skeptical Zone. Sep 20, 2016. “If the fitnesses stand in the ratio of 1.1 : 1.0 then Genghis Khan should be 10% more likely to survive... The truncation part is not in standard population-genetic models.” A blog comment by the population geneticist Joe Felsenstein on a post titled 'Evolution Visualized'. The article cites it because Felsenstein agreed with the article's 2015 test of Mendel's probability selection scheme, which found that the fitter individual won 20% more often, not 10%. ↩
- 36a.
A blog comment by the population geneticist Joe Felsenstein, answering a link to Crow and Kimura's 1979 paper on truncation selection, a model in which every individual below a fitness cutoff is removed. The article uses it as the mainstream objection to truncation, which it treats as stronger than Crow's own objection, because Felsenstein says the mechanism is not seen at work in populations. Cited here as url http://theskepticalzone.com/wp/evolution-visualized/comment-page-6/#comment-141834. ↩
- 36b.
A blog comment by the population geneticist Joe Felsenstein on The Skeptical Zone, arguing that much of the variation selection acts on is already present in a population rather than arising as new mutations. The article uses it to show that the simple comparison of new fixations ignores a third source of variation that selection can draw on without waiting for mutation. Cited here as url http://theskepticalzone.com/wp/evolution-visualized/comment-page-3/#comment-141205. “much of the variation that is being acted on by selection would not be new mutations, but would be existing alleles floating around in the population.” ↩
- 36a.
- 37.
Brewer, Wesley et al. “Using numerical simulation to test the 'mutation-count' hypothesis.” Biological Information: New Perspectives, 298–311. World Scientific. 2013. “Under these highly artificial conditions we found that MCM was indeed able to very effectively halt both mutation accumulation and fitness decline.” Figure 1: Mutation count plateaus near 125 per individual, and fitness stays at 0.94, flat to generation 350, at 10 new mutations per generation and 6 offspring per female. A chapter in the symposium volume Biological Information: New Perspectives, which Sanford co-edited, reporting a computer simulation of a population with harmful mutations. It tests the 'mutation-count' hypothesis that the title names. The article uses it as Sanford's own group's demonstration that the mechanism works, before arguing that the conditions are artificial. ↩
- 37a.
Figure 3: With a realistic spread of mutation effects, every selection scheme declines to extinction. Ranked by survival time, though, the schemes come out backwards: full truncation dies first, at about generation 4,700, and probability selection lasts to about 8,100. ↩
- 37a.
- 38.
Sanford, John C. “Biological information and genetic theory: introductory comments.” Biological Information: New Perspectives. World Scientific. 2013. Sanford writes that the mutation-count mechanism. “actually can work, but only when mutation effects are relatively uniform, when there is truncation selection, and where there is sexual recombination.” An introduction to a section of the symposium volume Biological Information: New Perspectives, written by John Sanford as the volume's co-editor. In it he states when the mutation-count mechanism works. The article uses it because the admission comes from Sanford's own volume, in his own words. ↩
- 39.
Milkman, Roger D. “Heterosis as a major cause of heterozygosity in nature.” Genetics 55(3):493–495. Mar 1967. Page 494: “a practical procedure in Drosophila, whose females produce scores of eggs.” “would drop to (0.95)256 = 0.0000023”. “This calculation is based on an erroneous concept of the independence of loci in selection; and its highly erroneous result leads to the improper exclusion of heterosis as a major mechanism in the maintenance of heterozygosity in nature.” A short reply in the journal Genetics to Lewontin and Hubby's 1966 argument that heterosis, meaning selection against individuals who carry two copies of the same variant, cannot keep many genetic loci variable. Milkman rejects their multiplicative calculation of population fitness, which treats each locus as if it acted alone; his answer, that loci are not independent, is the non-independence answer to a multiplicative load, given in 1967, and it anticipates the whole later dispute and is the ancestor of every synergistic-epistasis resolution since. The article uses it because Felsenstein names it as one of three 1967 papers that originated threshold selection models, alongside Sved, Reed and Bodmer, and King. ↩
- 40.
Bonnet, Timothée et al. “Genetic variance in fitness indicates rapid contemporary adaptive evolution in wild animals.” Science 376(6596):1012–1016. May 26, 2022. A pooled analysis of 19 wild bird and mammal populations, with 249,430 individuals across 561 fully monitored cohorts (groups of animals born together), followed for 11 to 63 years. It has 41 authors. Heritability is the share of the differences between animals that comes from genes, and the pooled heritability of fitness was 2.99% (95% CI 0.80-6.60), with additive genetic variance 0.185. The estimate varied between populations, and 11 of them came out below 1%. The article uses it as a direct measurement of how heritable fitness is in wild animals: about 3%. ↩ ↩
- 41.
Matheson, Joseph et al. “Substitution load revisited: a high proportion of deaths can be selective.” Genetics. Apr 2025. “The smallest proportion of selective deaths we observed across 8 environmental conditions was 8.5%, while in the more adverse environmental conditions within this experiment, 95% of deaths were selective.” A peer-reviewed study from the Masel lab of how many deaths in a population are selective, meaning caused by natural selection rather than by chance. It used the small flowering plant Arabidopsis under 8 environmental conditions. The article uses it because it tests Haldane's assumption directly and finds that the selective share can be far above his 10% ceiling, which cuts against the load argument. The authors flag less fecund species, which have fewer offspring, as future work. ↩
- 42.
Masel Lab, University of Arizona. Genetic load. n.d. Retrieved Jul 2026. “In the title of a 1995 paper, Alexey Kondrashov posed the puzzle 'Why have we not died 100 times over?'... Most work on mutation load periodically renormalizes relative fitness to deal with the fact that fitness keeps declining no matter what, or else treats only a subset of the genome. Either way, this is dodging the problem, not tackling its fundamentals, which are not specific to human mutation rates or to small population sizes.” The quotation is the page's full paragraph. The same page states their own answer, which this article quotes alongside the criticism, and this article is not stopping the quotation where it becomes inconvenient. A laboratory web page rather than a peer-reviewed statement, from the lab whose fixation counts (how many new mutations spread to a whole population) this article checks its own arithmetic against. The article uses it for the lab's own account of the mutation-load puzzle and its answer, a ratchet. ↩ ↩ ↩ ↩ ↩ ↩
- 43.
Hancock, Zach B. “Comment in 'Kondrashov's Paradox: Why We Haven't Died 100 Times Over'.” Peaceful Science. Jun 2026. On whether near-neutral means unselectable, the post says: “Consider the case in which Ns = 0.5 (beneficial, near neutral) and Ns = -0.5 (deleterious, near neutral). The former is 7.38 times more likely to fix than the latter, and 2.31 times more likely to fix than a strictly neutral mutation. This seems nothing like 'unselectable', in any sense of the word.” A forum comment, not peer-reviewed, quoted for what its author calls his own strongest argument. Hancock is a population geneticist and co-author, with Cardinale, of "Back to the fundamentals: a reply to Basener and Sanford 2018," Journal of Mathematical Biology 88, article 54 (2024), doi 10.1007/s00285-024-02077-w, the formal rebuttal to Basener and Sanford 2018. The article quotes the comment for its claim that most complex traits are highly polygenic, so selection works well even on weak alleles. ↩
- 44.
Charlesworth, Brian. “Why we are not dead one hundred times over.” Evolution 67(11):3354-3361. Nov 2013. A theory paper comparing weak stabilizing selection with weak purifying selection at many sites. Its two resolutions are a modest load under stabilizing selection and competition for limiting resources under soft selection. The assumptions about selection and recombination are central to both results. ↩
- 44a.
Section The Load Under Stabilizing Selection, final paragraph: “the load can be small to moderate, even with tens of millions of sites subject to selection of the strength estimated from population genetic data. There is thus no threat to the survival of the population. However, the relative importance of stabilizing versus purifying selection for synonymous and noncoding sites is currently unknown, so the question of the load under weak purifying selection also needs consideration.” ↩ ↩
- 44b.
Section The Load Under Purifying Selection, discussion following equations (8a) and (8b): “The situation is even worse in species with effective population sizes that are 10-fold or more smaller, and that have many more noncoding sites under selection, such as humans.” “Thus, in contrast to the situation with stabilizing selection, if there is genome-wide purifying selection of the type described by equation (4) on the scale suggested by the recent findings mentioned earlier, an extremely high level of genetic load is inevitable, in agreement with Kondrashov (1995a).” The numerical examples give loads of 0.83 and 0.97 for the synonymous-site model, and 0.998 and 1.00 with the larger noncoding-site count. ↩ ↩
- 44c.
Section Soft Selection and Variation in Fitness, paragraph beginning In general: “the mean fitness of the population relative to the fitness of a hypothetical optimal genotype that has a very low chance of being present in the population is essentially irrelevant. However, we need to be assured that the level of variation in fitness is not so large as to be implausible, but is large enough to be compatible with a selection coefficient of the order of 1/(4Ne).” ↩
- 44d.
Section The Load Under Stabilizing Selection, human example following equation (3): Conditional on 100 million selected sites, nucleotide diversity 0.001, effective size 20,000 and Sa squared = 5 times 10^-7, equation (3) gives a load of 0.05. ↩
- 44a.
- 45.
Hartl, Daniel L., and C. H. Taubes. “Compensatory nearly neutral mutations: selection without adaptation.” Journal of Theoretical Biology 182:303–309. Oct 7, 1996. “mutations that are slightly detrimental might be expected to be more numerous than favorable mutations owing to the previous incorporation of favorable mutations by a long history of natural selection”. An already-adapted genome has more ways to get worse than better. A 1996 paper by Daniel Hartl, a Harvard population geneticist, and C. H. Taubes, arguing from the mainstream side that compensating mutations repair earlier harm over long timescales, so that the process restores function without improving it. The authors take their premise from Ohta. The article uses it because Hartl and Taubes showed formally in 1996 that compensatory evolution brings no change or permanent improvement in enzymatic function. ↩ ↩ ↩
- 45a.
Page 305: Emphasis added. Their mechanism is Kacser's flux-control analysis: because the flux control coefficient relating enzyme activity to metabolic rate is typically small, most mutations in an enzyme have small effects, which is what puts them in the drift-barrier range in the first place. ↩
- 45a.
- 46.
Lynch, Michael, and Mark Menor. “The divergence of mean phenotypes under persistent Gaussian selection.” Genetics 229(4):iyaf031. 2025. A paper by Michael Lynch and Mark Menor on how far the mean of a trait in a population wanders under persistent Gaussian selection. Lynch originated the drift-barrier framing that Barton 2022 calls "problematic", so the article treats this as the same disagreement continued in print rather than a new one. ↩
- 46a.
Their mechanism is that. “random genetic drift... can cause observable gradients in the mean phenotypes of populations experiencing identical selection and mutation pressures”. That is, two populations under exactly the same stabilizing selection will end up at different phenotypic means, and how far they wander is set by effective population size. ↩
- 46a.
- 47.
Charlesworth, Brian. “Stabilizing Selection, Purifying Selection, and Mutational Bias in Finite Populations.” Genetics 194(4):955-971. Aug 2013. A theoretical comparison using two mutational models, numerical calculations and simulations. Mutational bias can make weak stabilizing selection produce variant-frequency spectra resembling those of purifying selection.
- 47a.
Section Introduction, paragraph beginning These results mean: “These results mean that studies utilizing data such as the frequency spectra of DNA sequence variants may find it virtually impossible to distinguish stabilizing from purifying selection.” This comparison concerns the models and sequence-frequency data discussed in the paper. ↩
- 47a.
- 48.
Galeota-Sprung, Benjamin et al. “Mutational Load and the Functional Fraction of the Human Genome.” Genome Biology and Evolution 12(4):273–281. Apr 2020. “Our conclusion is simply that an argument from mutational load does not appear to be particularly limiting on f.” Their objection: no mutation-free individual exists, so. “no calculation that depends on such an individual... is empirically relevant.” A theory paper that models the spread of fitness in a large, finite population at mutation-selection equilibrium, to ask whether mutational load can limit the functional fraction of the human genome. The article cites it in its discussion of how many new harmful mutations a species can carry, and for the authors' concession that many microbes may fit Haldane's load theory. ↩
- 48a.
“For many microbes, then, Haldane load theory may be appropriate.” Their contrast is explicit: humans carry nu = 1-10 while bacteria have nu much less than 1, so a mutation-free individual is common in a microbial population and essentially absent in a human one. Their E. coli figure is sourced to Kibota and Lynch 1996. The paper is cited elsewhere in this article for the opposite purpose, which is why the concession belongs with it. ↩
- 48a.
- 49.
Agrawal, Aneil F., and Michael C. Whitlock. “Mutation load: the fitness of individuals in populations where deleterious alleles are abundant.” Annual Review of Ecology, Evolution, and Systematics 43:115–135. 2012. Their model is MacArthur's rather than logistic, chosen because. “the parameters of the latter (especially 'carrying capacity') can be difficult to interpret in terms of individual-level traits.” “Selective deaths of adults after consumption but before reproduction reduce the size of the species in proportion to load. However, if the selective deaths occur early in life, such that β is small, the demographic consequences of load can be greatly reduced, at least at the adult stage.” A review of mutation load, the drop in fitness that many slightly harmful mutations cause in each individual, and of what that does to populations. The abstract says the ecological effects are not clear-cut, since some conditions reduce them while others let a small load have strong effects, even extinction. The article uses it for its conclusion that the demographic cost of load depends on when the deaths happen and on which vital rate the load hits. ↩
- 49a.
The authors decline to endorse the strong soft-selection dismissal (the claim that competition for resources cancels out the cost of load). “In fact, ecological processes are unlikely to completely mask the effects of genetic load.” “Load affects a species population size if individuals that die selective deaths remove resources that would otherwise be available to other members of the same species.” ↩
- 49b.
Section Supplemental Text 1, page 6: The two-stage model, in Supplemental Text 1. Their three stated conclusions: “First, and unsurprisingly, the effects of load are determined by the nature of competition during the life stage that has the greatest effect on population size. If the strongest competition is intraspecific, then the effects of load will behave qualitatively like pure intraspecific competition. Secondly, load on some fitness components have little effect on the population size, while load on other vital rates can have very strong effects. The effects of load depend on the details of the interaction within and among species.” ↩
- 49a.
- 50.
Lynch, Michael. “Mutation and Human Exceptionalism: Our Future Genetic Load.” Genetics. Mar 2016. “physical defects involving cancer, metabolic disease, and psychiatric disorders have very real costs regardless of the average population state.” A paper that answers the soft-selection rebuttal directly, arguing that physical defects from mutation carry real costs even when they are measured against the population average. The article uses it as its reply to the soft-selection rebuttal. ↩
- 51.
Glémin, Sylvain et al. “Quantification of GC-biased gene conversion in the human genome.” Genome Research 25(8):1215–1228. 2015. “The population-scaled coefficient B = 4N_e_b, where Ne is the effective population size and b is the intensity of the conversion bias.” “in the nearly neutral area”. “increases the frequency of G and C derived alleles... relative to A and T”. A genome study of GC-biased gene conversion, a bias that favours G and C over A and T, in African, European and East Asian samples. Its genome-average estimates of the population-scaled strength B run 0.27-0.43, with 1%-2% of the genome subject to strong gBGC at B above 5, and Pouyet and colleagues put the direction plainly in the words quoted below, the bias opposing the genome's mutational bias toward AT. The article uses it to show that its equilibrium numbers hold at genome-average values but not in the 1%-2% of the genome under strong bias. ↩
- 51a.
This is the article's own arithmetic, not Glémin and colleagues'. The equilibrium function 3/(3 + ex) is the logistic 1/(1 + e^(x − ln 3)^), so its inflection is at x = ln 3 ≈ 1.0986, where it equals exactly ½ and where averaging a symmetric ± shift leaves the mean unchanged. gBGC enters as a shift of ±B/2 in these units, since B is defined on 4Ne and x on 2Ne. Sweeping x from 0.01 to 6 at B = 0.4, under both a 50/50 split of functional sites between G/C-requiring and A/T-requiring and a 41/59 split matching human genome GC content, the largest absolute change in the fraction of sites sitting wrong is 0.96 percentage points, at 2·Ne·s = 1.58. At hotspot strength (B = 5) the shifts are large, for example 5.2% to 20.3% at 2·Ne·s = 4, which is why the caveat about hotspots is stated rather than buried. ↩
- 51a.
- 52.
Latrille, Thibault et al. “Estimating the proportion of beneficial mutations that are not adaptive in mammals.” PLoS Genetics 20(12):e1011536. Dec 2024. An estimate of how many beneficial mutations in mammals are not adaptive, across 28 populations from six mammalian genera: Equus, Bos, Capra, Ovis, Chlorocebus and Homo. The article cites both halves of its result, because the first supports it and the second constrains it. ↩
- 52a.
Their range across all 28 populations runs from 11% to 82% with a mean near 30%; the 15-45% figure covers 24 of the 28. "Non-adaptive" in their sense means beneficial because it restores a previously lost state, as distinct from beneficial because it improves on the ancestral one, which is precisely the repair-versus-innovation distinction this article's Argument 3 turns on, measured. ↩
- 52a.
- 53.
Ardell, Sarah M. et al. “Environment-independent distribution of mutational effects emerges from microscopic epistasis.” Science 386(6717):87–92. Oct 4, 2024. A yeast experiment that measured the effects of about 100 insertion mutations in 42 strains of Saccharomyces cerevisiae across six laboratory environments. The article treats it as the strongest measurement of fitness-dependent feedback in the literature, and cites it as the best evidence against the version of its argument that predicts unbounded fitness decline. ↩
- 53a.
Their counts of sign-switching across strains and conditions. Read together with the 100%-at-lowest-fitness projection, the picture is that "beneficial" and "deleterious" are properties of a mutation in a background, not of the mutation. ↩
- 53b.
From the abstract: “We measured the fitness effects of ~100 insertion mutations in 42 strains of Saccharomyces cerevisiae in six laboratory environments and found that the global-epistasis scaling is nearly invariant across environments. Instead, the environment tunes one global parameter, the background fitness at which most mutations switch sign. As a consequence, the distribution of mutational effects is predictable across genotypes and environments.” ↩
- 53a.
- 54.
Couce, Alejandro et al. “Changing fitness effects of mutations through long-term bacterial evolution.” Science 383(6681):eadd1417. Jan 26, 2024. “most mutations are nearly neutral (within ~2 to 3% of neutrality, depending on the strain), but in all cases having a much heavier tail of deleterious mutations than beneficial mutations.” An experiment on E. coli that tracked the fitness effects of insertion mutations in every gene across 50,000 generations of evolution, in 12 populations. Its higher-resolution scan gives 6.8% beneficial in the ancestor against 4.3% and 3.2% after 2,000 and 15,000 generations, so the article uses it to show that the beneficial share shrinks as a population adapts. Effects are only reliably distinguishable above s = 0.03, so smaller effects cannot be told apart from measurement noise. ↩ ↩ ↩ ↩
- 55.
Silander, Olin K. et al. “Understanding the evolutionary fate of finite populations: the dynamics of mutational effects.” PLoS Biology. Apr 2007. The authors report: “The ML estimate of B, the proportion of beneficial mutations, was zero for all high-fitness populations and greater than zero in all low-fitness populations.” A study of bacteriophage (viruses that infect bacteria) carried through bottlenecks of 3 to 250, which estimated the proportion of beneficial mutations (B) in populations of high and low fitness. The paper does not settle whether B = 0 is a true zero or simply the limit of its resolution. The article uses it for the finding that the beneficial fraction was zero in every high-fitness population and above zero in every low-fitness one. ↩ ↩
- 56.
Sharp, Nathaniel P., and Aneil F. Agrawal. “Evidence for elevated mutation rates in low-quality genotypes.” PNAS 109(16):6142–6146. 2012. Their measurement is of mutation rates on chromosomes unlinked to the deleterious alleles carried, which makes it a claim about the genome-wide rate rather than about local instability. Aneil Agrawal is also the lead author of the mutation-load review this article uses for the demographic argument, so the same group appears on both sides of the ledger. The article quotes them for a mutational positive feedback loop in which low-quality genotypes produce offspring of even lower genetic quality. ↩
- 56a.
For a 10% reduction in body mass relative to wild type. Note the direction of the asymmetry: the rate of mutational decline rises faster than the mutation rate itself, because a faster rate of arrival interacts with a distribution of effects rather than adding uniformly. ↩
- 56a.
- 57.
Bao, Kevin et al. “Are mutations usually deleterious? A perspective on the fitness effects of mutation accumulation.” Evolutionary Ecology. Jun 21, 2022. Of the Arabidopsis work it says: “Shaw et al. (2000) concluded that about half of all mutations that occurred in their study were beneficial.” A mainstream review of mutation accumulation experiments, in which lines are kept at small population size so that mutations build up. It catalogues lines that show no fitness decline in Arabidopsis, C. elegans, Daphnia, yeast and Chlamydomonas. The article cites it for those lines, which get no worse, and for the report of Shaw and colleagues' conclusion on beneficial mutations. ↩
- 58.
Böndel, Katharina B. et al. “Kin selection and the evolution of social behaviour: fitness effects of spontaneous mutations in Chlamydomonas reinhardtii.” PLoS Genetics 18(6):e1009840. Jun 2022. A laboratory tracking study of 254 spontaneous mutations, in which each was followed by how its frequency changed over roughly 60 generations, rather than inferred from a fitted distribution. Peter D. Keightley is senior author, as he is on Böndel 2019, Chebib 2024, Eyre-Walker and Keightley 1999 and Lesecque 2012, so the same group appears on most of the evidence in this dispute, on both sides of it. The article uses it as the most direct measurement in its list, and it finds the distribution symmetric. ↩
- 58a.
Their own environmental caveat is the beneficial-by-destruction argument this article makes elsewhere: advantageous mutations in their assay may be losses of function in genes not required in laboratory culture. Their mean absolute effect is. “just over 2%”. , which is 500 times the human drift barrier of 0.005%. ↩
- 58a.
- 59.
Joseph, Sarah B., and David W. Hall. “Spontaneous mutations in diploid Saccharomyces cerevisiae: more beneficial than expected.” Genetics. Dec 2004. “We found that 5.75% of the fitness-altering mutations accumulated were beneficial. This finding contradicts the widely held belief that nearly all fitness-altering mutations are deleterious.” A 1,012-generation experiment on diploid yeast (Saccharomyces cerevisiae), in which mutations built up. The authors found 5.75% of the fitness-altering mutations were beneficial, which they say contradicts the widely held belief that nearly all are deleterious. The lines still showed "a significant reduction in mean fitness" overall. The article lists it among measured beneficial fractions that all clear the 2% bar. ↩
- 60.
Firnberg, Elad et al. “A comprehensive, high-resolution map of a gene's fitness landscape.” Molecular Biology and Evolution. Jun 2014. “Only 7.1% (1,074/15,167) of the alleles and 7.0% (367/5,212) of the missense mutations increased fitness above that of TEM-1 outside the range of the error.” A 2016 erratum corrects equation 6 only, not these figures. A scan that measured the fitness effect of mutations across the gene for TEM-1 β-lactamase, an enzyme that gives bacteria resistance to ampicillin. Fitness here is ampicillin resistance, and TEM-1 is under heavy recent selection for expanded resistance, the far-from-optimum condition that inflates the beneficial fraction. The article cites its figure of 7.0% beneficial missense mutations among the measured beneficial fractions, which it sets against the much lower assumed rate of beneficial mutations. ↩ ↩ ↩
- 61.
Goyal, Sidhartha et al. “Dynamic mutation-selection balance as an evolutionary attractor.” Genetics. Aug 2012. “for a small population Ns ∼ 103 with high mutation rate λ ∼ 8, just 2% beneficial mutations are enough to counteract the effect of deleterious mutations.” A 2012 theory paper that models a population with a high mutation rate and no sex, so Muller's ratchet (the one-way build-up of harmful mutations in a lineage that cannot swap genes) keeps running. The population is a hard test of the claim, not an easy one. The article uses it to show that roughly 2% beneficial mutations are enough to hold the line against that ratchet. ↩
- 62.
Crombie, Timothy A. et al. “The distribution of fitness effects of spontaneous mutations in Caenorhabditis elegans inferred from mutation accumulation lines with reduced linkage disequilibrium.” Genetics 228(2):iyae136. 2024. “Estimates of the distribution of fitness effect from experimental mutation accumulation lines are compromised by the complete linkage disequilibrium between mutations in different lines.” A study of 517 lines of the roundworm Caenorhabditis elegans, with 169 mutations, whose parental lines were roughly 200-220 generations old. The authors' opening statement of the problem, quoted below, is that linkage between mutations makes estimates from such lines unreliable. The article cites it because it removes the confound that makes every line's mutations inseparable, and it shows the high beneficial fractions are probably an artefact. ↩
- 62a.
From the discussion. This directly undercuts the review the article cites against itself, the Arabidopsis, C. elegans, Daphnia, yeast and Chlamydomonas results showing no decline, and Shaw's finding that. “about half of all mutations were beneficial.” Those are exactly the estimates Crombie's design was built to test, and they did not survive it. Both are kept here because the reader should see the correction rather than only the conclusion. ↩
- 62b.
From the same paper, which this article also cites in its favour. Reported here because a source cannot be used for one of its findings and quietly dropped for another. ↩
- 62a.
- 63.
Wahl, Lindi M., and Deepa Agashe. “Selection bias in mutation accumulation.” Evolution. Mar 2022. “These results highlight that positive selection during microbial MA experiments is in fact not negligible, but can be corrected to gain a more accurate understanding of fundamental evolutionary parameters.” A study of microbial mutation accumulation (MA) experiments, which argues that positive selection in them is not negligible but can be corrected for. The article uses it for the point that these experiments are biased upward regardless, because selection cannot be switched off entirely during colony expansion. ↩
- 64.
Moran, Laurence A. “Breaking news: Creationist Vincent Torley lies and moves goalposts.” Sandwalk. Apr 2, 2014. A blog comment, not a publication, in which Moran labels his figure a guess. Moran is professor emeritus of biochemistry at the University of Toronto and one of the most persistent critics of intelligent design and of ENCODE's functional claims. His estimate is quoted because it comes from someone with every reason to make the adaptive number large. The article uses it for that guess, which it says should not be reported as a measurement. Mirror: Archive.org ↩
- 65.
Musgrave, Ian. “Haldane's non-dilemma.” The Panda's Thumb. Jul 1, 2007. “Walter ReMine's claim that 1667 beneficial mutations is too few to generate a philosopher poet from the common ancestor of chimps and humans is shown to be trivially false from comparison of the human and chimp gemone”. The spelling gemone is as printed in the post (sic). A blog post by Ian Musgrave, a senior lecturer in pharmacology at the University of Adelaide, not a population geneticist. The article cites it in its discussion of estimates of adaptive substitution in the human lineage. ↩
- 66.
Behe, Michael J. “Experimental evolution, loss-of-function mutations, and the first rule of adaptive evolution.” The Quarterly Review of Biology 85(4):419–445. Dec 2010. A peer-reviewed survey by Michael Behe, a biochemist at Lehigh and an advocate of intelligent design, of molecular changes in adaptations, with an emphasis on laboratory evolution experiments with microbes over four decades. He finds that by far the most common adaptive changes are the loss or modification of a pre-existing molecular function, not the gain of a new one. Because the survey is of published experiments, it can be checked against them. The article uses it to source its claim that adaptation usually proceeds by breaking things, and it quotes Behe's own statement of that claim's limit. ↩
- 66a.
Behe's own limit on the claim, in his words: “is called a 'rule' in the sense of being a rule of thumb. It is a heuristic, useful generalization, rather than a strict law.” ↩
- 66a.
- 67.
Denver, Dee R. et al. “Selective sweeps and parallel mutation in the adaptive recovery from deleterious mutation in Caenorhabditis elegans.” Genome Research 20(12):1663–1671. Dec 2010. “virtually all nonrepetitive genomic regions (>80% of the total genome)”. The authors resequenced the whole genome of the progenitor, the degraded line and three recovery lines. The article uses it for the finding that no reversions were detected and that intergenic compensatory mutations likely drove the recovery. The sequencing covered. ↩
- 67a.
Section Discussion: They add that this. “might be a common avenue for genetic change within complex multicellular organisms”. ↩
- 67a.
- 68.
Orr, H. Allen. “Dennett's Strange Idea.” Boston Review. 1996. A review in the Boston Review by H. Allen Orr, an evolutionary geneticist at Rochester. It is a hostile review of Daniel Dennett rather than anything sympathetic to design. The article uses it because Orr states the accounting argument in general form, as a mainstream evolutionary geneticist who was attacking intelligent design at the time. ↩
- 69.
Hledík, Michal et al. “Accumulation and maintenance of information in evolution.” PNAS 119(36):e2123152119. Sep 6, 2022. “Selection is most efficient when it is relatively weak (Ns≪1), maintaining up to N/μ(1+4Nμ) bits per unit cost at the genotype level, and inefficient when strong (Ns≫1), maintaining only about ln(2)/μ bits per unit cost.” Their load is defined as the lead, meaning the gap to the fittest individual actually present, not the lag load: “L(x)=1−1/ŵ_max(x), where ŵ_max(x) is the maximum relative fitness present in the population x.” Their own caveat: “Typical populations have Ne/μ much greater than the genome size, suggesting that the genome size or other factors are more limiting,”. “more work is needed to make claims about the information content of any real organism's genome.” A paper by three authors on how much information a population can build up and keep, measured in bits (the units of information) per unit of cost, when selection is weak and when it is strong. The article uses it for the point that weak selection holds information most cheaply, and for the authors' own caution about measuring information in any real genome. ↩ ↩ ↩
- 70.
Hottes, Alison K. et al. “Bacterial adaptation through loss of function.” PLoS Genetics 9(7):e1003617. Jul 2013. “Using selection experiments on transposon-mutagenized libraries of bacteria, we illustrate that even under conditions of extreme nutrient limitation, substantial adaptation can be achieved solely through loss of function mutations, which rewire the metabolism of the cell without gain of enzymatic or sensory function. A systematic analysis of similar experiments under more than 100 conditions reveals that adaptive loss of function mutations exist for many environmental challenges.” “at least one beneficial null mutation was identified in all but five of the 144 conditions considered.” A laboratory survey in which the authors ran selection experiments on transposon-mutagenized libraries of bacteria, collections of cells each carrying random insertions that disable genes, under more than 100 conditions. The authors are from the Tavazoie lab, Columbia and Princeton, with no connection to this debate. The article uses it as the measured evidence that adaptive loss of function is available almost everywhere anyone has looked, and the 139-of-144 figure is the authors' own count. ↩
- 71.
Klim, Joanna et al. “Loss-of-function mutations are main drivers of adaptations during short-term evolution.” Scientific Reports 14:7128. 2024. “The presented results confirm expectations of the classical 'less is more' hypothesis that loss-of-function mutations play a basic role in rapid adaptation to ecological conditions.” A meta-analysis of 58 published studies covering 65 evolution experiments, using a modified dN/dS statistic applied to nonsense mutations (changes that stop a protein early). The authors say the results support the classical less is more hypothesis, that losing function helps rapid adaptation. The article cites it because its title makes a strong claim that the article's own numbers qualify. ↩
- 71a.
Their actual count, quoted so this article does not overstate it: “In 17 cases, the nonsense substitution rate was significantly higher than the synonymous substitution rate (dNONSENSE > dS, p-value < 0.05).” That is 17 of 65 experiments reaching significance, so the title's claim rests on the aggregate rather than on a majority of individual experiments. Note also the scope in their own title: short-term evolution. ↩
- 71a.
- 72.
Lang, Gregory I. et al. “Pervasive genetic hitchhiking and clonal interference in forty evolving yeast populations.” Nature 500(7464):571–574. Aug 29, 2013. A study of forty yeast populations grown for 1,000 generations, and one of the few studies that classifies adaptive mutations by what they did to the gene. Only 1 of 141 driver mutations is synonymous (against 19% at singly-hit genes), and drivers are enriched for nonsense and frameshift mutations, which supports the destruction reading, though the cell-wall loci show that enrichment is not universal. Their taxonomy has no bin for construction, and the choice they report is between loss and attenuation, so this study cannot measure the constructive share even in principle; the article cites it on both sides. ↩
- 73.
Zhuang, Xuan et al. “Molecular mechanism and history of non-sense to sense evolution of antifreeze glycoprotein gene in northern gadids.” PNAS 116(10):4400–4405. 2019. A study that traces the codfish antifreeze glycoprotein gene to a minimal noncoding sequence, with the intermediate steps reconstructed. The Antarctic notothenioid version evolved independently from a trypsinogen-like protease (TLP) gene, so two unrelated fish lineages show the same function arising twice. The article cites it against its own leaning, and the convergence of two independent origins on the same function is harder to dismiss than either alone. ↩
- 74.
Helsen, Jana et al. “Gene loss predictably drives evolutionary adaptation.” Molecular Biology and Evolution 37(10):2989–3002. Oct 2020. “we found that gene loss can enhance an organism's capacity to evolve and adapt... losing highly connected genes increased evolvability by facilitating the emergence of a more diverse array of phenotypes after adaptation. Together, our findings show that loss of specific parts of a genetic network can facilitate adaptation by opening alternative evolutionary paths.” A study of how losing genes changes an organism's capacity to evolve and adapt. The article cites it as the strongest mainstream answer to the loss-of-function point, because gene loss can open alternative evolutionary paths. ↩
- 75.
Xu, Yong-Chao et al. “Adaptation and phenotypic diversification in Arabidopsis through loss-of-function mutations in protein-coding genes.” The Plant Cell 31(5):1012–1025. 2019. A survey of loss-of-function mutations in Arabidopsis, the largest such survey in any plant and the closest thing to an adaptive fraction that this literature contains. The 1% figure is for one population, the Yangtze River basin. The article uses it for that adaptive yield. ↩
- 76.
Xu, Yong-Chao, and Ya-Long Guo. “Less is more, natural loss-of-function mutation is a strategy for adaptation.” Plant Communications 1(6):100103. 2020. A review of loss-of-function mutation as a route to adaptation, built on the survey by Xu and colleagues. The article cites it for the concession in its own abstract, which is a more careful statement than its title. ↩
- 77.
Huelsmann, Matthias et al. “Genes lost during the transition from land to water in cetaceans highlight genomic changes associated with aquatic adaptations.” Science Advances 5(9):eaaw6671. Sep 25, 2019. A screen of four cetacean genomes for protein-coding genes lost in the ancestral whale and dolphin lineage, which found 85 gene losses, 62 of them not reported before. It reports both the total and the roughly eleven losses given an adaptive story, which the article says most gene-loss papers do not do. The article uses it for that ratio of roughly eleven adaptive out of 85, and for the authors' own summary that many of these losses were likely neutral. ↩
- 78.
Gross, Briana L., and Kenneth M. Olsen. “Genetic perspectives on crop domestication.” Trends in Plant Science 15(9):529–537. 2010. A paper on the genetics of crop domestication, which separates domestication genes from post-domestication improvement genes. Their Table 1 splits the two cases: frank loss-of-function is a minority among domestication genes but a majority among post-domestication improvement genes, which is probably why the literature disagrees with itself on this point. The article cites it against its own leaning. ↩
- 79.
Natsidis, Paschalis et al. “Systematic errors in orthology inference and their effects on evolutionary analyses.” iScience 24(2):102110. 2021. A methodological control in which the authors simulate data with no gene loss in it, then check whether the orthology pipeline reports gene loss anyway, and it does. The article says most gene-loss papers do not run this control, and it uses the study as a caution, since the same critique inflates the gain counts too. ↩
- 80.
Albalat, Ricard, and Cristian Cañestro. “Evolution by gene loss.” Nature Reviews Genetics 17:379–391. 2016. A review of gene loss in evolution, and the standard review of the field. It asks the question this section asks and reports that the data to answer it do not exist. The article cites it against its own leaning. ↩
- 81.
Sanford, John et al. “The waiting time problem in a model hominin population.” Theoretical Biology and Medical Modelling. Sep 17, 2015. “We simulated a classic pre-human hominin population of at least 10,000 individuals, with a generation time of 20 years, and with very strong selection (50 % selective elimination)... To establish a string of two nucleotides required on average 84 million years. To establish a string of five nucleotides required on average 2 billion years.” The model requires a pre-specified target string, which is its main methodological weakness. A computer simulation of a model population of pre-human hominins (the human line after it split from the chimpanzee line), asking how long it takes for a specific short string of DNA letters to become established. It is peer reviewed in a secular journal, and the authors are young-earth creationists (who hold that the Earth is only thousands of years old) with no competing interests declared. The article uses it for its waiting times: two nucleotides took on average 84 million years and five took 2 billion. ↩
- 82.
Sanjuán, Rafael et al. “The distribution of fitness effects caused by single-nucleotide substitutions in an RNA virus.” PNAS. Jun 1, 2004. The authors caution: “some of the mutations classified as neutrals could actually have a fitness effect too weak to be detected by our experimental method.” A laboratory study of 91 site-directed mutants of vesicular stomatitis virus, an RNA virus, each carrying one changed nucleotide. Among random mutations it found 39.6% lethal, 29.2% deleterious, 27.1% neutral and 4.2% beneficial, though the last figure rests on 2 mutations out of 48. The article cites it among the direct measurements of the beneficial fraction, which it puts at 1% to 7%. ↩
- 83.
Kinsler, Grant et al. “Extreme sensitivity of fitness to environmental conditions: lessons from #1BigBatch.” Journal of Molecular Evolution 91(3):293–310. 2023. A paper from Dmitri Petrov's laboratory at Stanford, which builds barcode-lineage-tracking assays, the highest-throughput fitness measurements that exist. It reports that the field's precision is capped at 0.1% to 1%, which is 20 to 200 times coarser than the human drift barrier of 0.005%. The article uses it for the measurement gap: natural selection can act on differences too small for the laboratory to measure. ↩
- 83a.
The sentence that follows the quotation cites Ohta 1973 and Lynch and Conery 2003 for the point. This is the measurement gap stated by the people it most inconveniences, and it is the reason this article's conclusion is an open question rather than a result. ↩
- 83a.
- 84.
Shabalina, Svetlana A. et al. “Rapid decline of fitness in panmictic populations of Drosophila melanogaster maintained under relaxed natural selection.” PNAS. Nov 25, 1997. “the number of surviving offspring per female declined by 0.2% and 2.0% per generation under benign and harsh, competitive conditions, respectively. Thus, the mutational pressure on fitness may be strong and depends critically on the conditions under which fitness is assayed.” An experiment on fruit flies (Drosophila melanogaster) kept in populations where natural selection was relaxed, measuring how many offspring survived per female each generation under benign and under harsh, competitive conditions. The article uses it because the competitive assay found about ten times the benign rate of decline. ↩
- 85.
Katju, Vaishali, and Ulfar Bergthorsson. “Old Trade, New Tricks: Insights into the Spontaneous Mutation Process from the Partnering of Classical Mutation Accumulation Experiments with High-Throughput Genomic Approaches.” Genome Biology and Evolution. Jan 1, 2019. “phenotypic estimates of U in eukaryotes ranged widely (>700-fold) from 0.00065 to 0.47 per genome per generation.” The review also reports that. “assays under competitive or stress conditions tend to yield higher estimates of U... relative to benign assays.” A review that pairs the classic mutation-accumulation experiments, in which lines of organisms are bred for many generations so that mutations build up, with modern high-throughput genome sequencing. It gathers the estimates of U (the number of harmful mutations per genome per generation) for eukaryotes, which are organisms whose cells have a nucleus. The article uses it to show that measured rates vary by more than 700-fold. ↩
- 86.
Estes, Suzanne, and Michael Lynch. “Rapid fitness recovery in mutationally degraded lines of Caenorhabditis elegans.” Evolution. May 2003. “mutationally degraded lines are capable of recovering original levels of mean fitness at a rate that is at least three times that of mutational degradation in the absence of selection.” The authors conclude. “compensatory mutation appears to be the only viable explanation”. The recovered genomes carry more mutations, not fewer. A laboratory experiment on the nematode C. elegans, in which lines whose fitness had been degraded by mutation were put under selection to see how fast they recovered. The article cites it because the lines recovered quickly, which cuts against the genetic entropy expectation. ↩
- 87.
Katju, Vaishali et al. “Fitness decline in spontaneous mutation accumulation lines of Caenorhabditis elegans with varying effective population sizes.” Evolution. Jan 2015. “Larger populations (N = 10 and 100) did not suffer a significant decline in fitness traits despite a lengthy and sustained regime of consecutive bottlenecks exceeding 400 generations.” A laboratory experiment on the roundworm Caenorhabditis elegans, in which mutations were allowed to build up in lines kept at different effective population sizes (the number of breeding individuals that sets how strongly drift acts). The lines went through repeated bottlenecks, sharp drops in population size. The article uses it to show that populations of 10 or 100 did not decline significantly. ↩
- 88.
Crotty, Shane et al. “RNA virus error catastrophe: direct molecular test by using ribavirin.” PNAS. May 22, 2001. “A 99.3% loss in viral genome infectivity is observed after a single round of virus infection in ribavirin concentrations sufficient to cause a 9.7-fold increase in mutagenesis.” A direct molecular test of whether the antiviral ribavirin pushes an RNA virus into error catastrophe. The article cites it for the 99.3% loss of infectivity in a single round of replication. ↩
- 89.
Loeb, Lawrence A. et al. “Lethal mutagenesis of HIV with mutagenic nucleoside analogs.” PNAS. Feb 16, 1999. “In seven of nine experiments, the presence of this analog resulted in the loss of viral replicative potential after 9–24 sequential passages of HIV in human CEM cells. In contrast, loss of viral replication was not observed in 28 control cultures.” A laboratory experiment that grew HIV in human CEM cells and treated it with a mutagenic nucleoside analog, a chemical that makes the virus copy its genome with more errors. The article uses it for the HIV case, where the drug drove the virus to extinction in 7 of 9 cultures, while none of the 28 control cultures lost replication. ↩
- 90.
Arias, Armando et al. “Favipiravir elicits antiviral mutagenesis during virus replication in vivo.” eLife. Oct 21, 2014. “After 53 days of treatment with favipiravir, infectious virus titres were undetectable in the faeces of 7 out of 9 animals, while only 2 out of 10 animals had undetectable titres in the control group.” An experiment on animals given the antiviral favipiravir and compared with a control group, testing their faeces for infectious virus. The title names the mechanism, antiviral mutagenesis, meaning the drug makes the virus accumulate mutations. The article cites it for its claim that favipiravir cleared norovirus from treated mice. ↩
- 91.
Uchimura, Arikuni et al. “Germline mutation rates and the long-term phenotypic effects of mutation accumulation in wild-type laboratory mice and mutator mice.” Genome Research 25(8):1125–1134. Aug 2015. “The mutation rate in mutator mice was 17 times that in wild-type mice. Abnormal phenotypes were 4.1-fold more frequent in the mutator lines... many of the breeding lines died out.” Mean offspring fell to 36% of the starting population. Wild-type lines showed no comparable collapse. A laboratory study in which mice were bred for more than 20 generations, some as normal laboratory mice and some as mutator mice, which copy their DNA with more errors. It measured how fast new mutations appear and what they did to the animals' traits and breeding. The article uses it to show what a higher mutation rate does to a mammal population: 4.1 times more abnormal phenotypes, fertility falling to 36% of baseline, and many breeding lines dying out. ↩
- 92.
Bull, James J. et al. “Theory of lethal mutagenesis for viruses.” Journal of Virology 81(6):2930–2939. Mar 2007. Page 2930: “an error catastrophe is an evolutionary shift in genotype space, whereas extinction is a demographic process, a drop in the absolute abundance of individuals in the population.” A theory paper that gives the first formal model of lethal mutagenesis, the killing of a virus by raising its mutation rate. It finds that the extinction threshold depends on an ecological part as well as the mutation rate, so the rate alone cannot give it. The article cites it for the point that killing a virus by mutation is not Eigen's error catastrophe. ↩
- 93.
Guillemet, Martin et al. “Lethal mutagenesis and the transient within-host dynamics of viral adaptation.” Virus Evolution. Oct 28, 2025. “the fold increase in the viral mutation rate required to reach the critical mutation rate of six different viruses ranges from 11 to 2700... lethal mutagenesis seems difficult to achieve since available estimates... indicate that they increase viral mutation rate by a factor of 10 at most.” A 2025 analysis of six viruses. Lethal mutagenesis is the attempt to push a virus's mutation rate high enough that it can no longer survive, and the paper asks how far each virus's rate would have to rise to reach that critical level. Its quoted conclusion is that available estimates show the mutation rate rising by a factor of 10 at most. The article uses it to argue that the rates required are enormous. ↩
- 94.
Sanderson, Theo et al. “A molnupiravir-associated mutational signature in global SARS-CoV-2 genomes.” Nature. Nov 2023. “a cluster in Australia in August 2022 involved 20 tip sequences, with distinct age metadata confirming they derived from multiple individuals.” A study of SARS-CoV-2 genome sequences from around the world that looked for the mutation pattern left by molnupiravir, an antiviral drug that causes mutations. Its finding was that drug-induced mutagenesis produced viable, transmissible virus rather than sterilising it. The article uses it for the point that raising the mutation rate produced viable, transmissible descendants. ↩
- 95.
Springman, Rachael et al. “Evolution at a High Imposed Mutation Rate: Adaptation Obscures the Load in Phage T7.” Genetics 184(1):221–232. Jan 2010. The abstract says: “Fitness—viral growth rate in the mutagenic environment—was predicted to decline substantially; after 200 generations, fitness had increased, rejecting the model. A high mutation load was nonetheless evident from (i) many low- to moderate-frequency mutations in the population (averaging 245 per genome) and (ii) an 80% drop in average burst size.” The 4.3 figure is theirs: “Estimates from two independent lines were 4.9 and 3.6 (average 4.3) mutations per genome per mutagenic generation.” Fitness went from 18.3 to 21.9 doublings per hour, against a predicted 8.6, while 245 mutations per genome segregated and burst size fell 80%. A laboratory experiment that grew the bacteriophage T7, a virus that infects bacteria, with a mutagen, giving it about 4 nonlethal mutations per generation, two to three orders of magnitude above its baseline rate. Theory predicted that its fitness would fall. The study tests the theory behind lethal mutagenesis, the idea that a high enough mutation rate drives a population to extinction. The article uses it as its counter-experiment, since fitness rose instead of falling. ↩
- 96.
Fu, Wenqing et al. “Analysis of 6,515 exomes reveals the recent origin of most human protein-coding variants.” Nature. Jan 10, 2013. “We estimate that ~73% of all protein-coding SNVs and ~86% of SNVs predicted to be deleterious arose in the past 5,000-10,000 years.” Mean age of conservatively deleterious variants: 5.2 kyr in European Americans. A study that analysed the protein-coding DNA (exomes) of 6,515 people and dated the variants found in them. The article cites it for the strongest single result, and for the caveat that the 5,000-year figure comes from a fitted demographic model, not from measured variant ages. ↩
- 96a.
“we report results based on a modified Out-of-African model in which accelerated population growth began 5,115 years ago with a per generation growth rate of 1.95% and 1.66% for EAs and AAs, respectively.” ↩
- 96b.
Their stated model. The 5,115-year figure is the assumed onset of accelerated growth, not a finding. The widely repeated claim. “most deleterious variants arose in the last 5,000 years”. is downstream of it. The coincidence between that number and a young-earth chronology is arithmetic, not evidence. ↩
- 96c.
Their own sensitivity analysis. Quoted in full so this article does not overstate the criticism: the age estimates are not fragile, they are conditional. A twofold uncertainty on an average age is also worth noting in its own right, because it is wider than the precision with which the 5,000-year figure is usually repeated. ↩
- 96a.
- 97.
MacArthur, Daniel G. et al. “A systematic survey of loss-of-function variants in human protein-coding genes.” Science. Feb 17, 2012. “We estimate that human genomes typically contain ~100 genuine LoF variants with ~20 genes completely inactivated.” A survey of human protein-coding genes for loss-of-function variants, the mutations that switch a gene off. Only 43.5% of the raw candidate calls survived filtering, which is a caution for any large count taken from it. The article uses its count of about 100 such variants per genome, with about 20 genes completely inactivated. ↩
- 98.
Sulem, Patrick et al. “Identification of a large set of rare complete human knockouts.” Nature Genetics. May 2015. A study of genotyped Icelanders that identified rare human genes completely knocked out by loss-of-function variants. It found that 7.7% of genotyped Icelanders were homozygous or compound-heterozygous for loss-of-function variants across 1,171 genes. Brain-expressed genes were knocked out less often than others, and homozygous LoF offspring appeared less often than chance predicts. The article uses its 7.7% figure for how many Icelanders are complete knockouts for at least one gene. ↩
- 99.
Xue, Yali et al. “Deleterious- and Disease-Allele Prevalence in Healthy Individuals: Insights from Current Predictions, Mutation Databases, and Population-Scale Resequencing.” American Journal of Human Genetics. Dec 7, 2012. “our current best mean estimates of ~400 damaging variants and ~2 bona fide disease mutations per individual are likely to increase rather than decrease as sequencing studies ascertain rare variants more effectively.” A research paper that estimates how many damaging gene variants a healthy person carries, using computer predictions, mutation databases and sequencing of many people. The figures are averages, and the authors expect them to rise as rarer variants are found. The article uses them for its statement that every person carries about 400 highly damaging variants and about 2 disease mutations. ↩
- 100.
Harris, Kelley, and Rasmus Nielsen. “The Genetic Cost of Neanderthal Introgression.” Genetics. Jun 2016. “the median Neanderthal was found to have fitness 0.63 compared to the median human.” Residual Neanderthal load in non-Africans: at least a 0.5% fitness reduction. A 2016 paper that measures the genetic cost of Neanderthal DNA, meaning the DNA that passed from Neanderthals into the ancestors of people today through interbreeding (introgression). Cost is measured as fitness, which is how many descendants a genotype leaves compared with others. The article uses it to show that Neanderthals carried a load putting their median fitness near 0.63 of modern humans. ↩
- 101.
Berens, Ali J. et al. “The Genomic Health of Ancient Hominins.” Human Biology. 2017. “the overall genomic health of the Altai Neandertal is worse than 97% of present day humans.” A study that scored 147 ancient genomes by genetic risk score. Its headline result is that the Altai Neandertal genome scores worse than 97% of present-day humans. The article cites it for the Neanderthal load and for the paper's counter-evidence, that genomic health improved from the deep past toward the recent past. Mirror: bioRxiv ↩
- 101a.
“The genomic health of ancient individuals appears to have improved over time... However, there exists a perplexing pattern: ancient individuals who lived within the last few thousand years have healthier genomes, on average, than present day humans.” ↩
- 101a.
- 102.
Kong, Augustine et al. “Selection against variants in the genome associated with educational attainment.” PNAS. Jan 31, 2017. “the average POLYEDU has been declining at a rate of ∼0.010 standard units per decade,”. The authors add that the Flynn effect runs at. “3.0 points per decade... in the opposite direction.” A 2017 study of selection against genetic variants linked to educational attainment in Iceland, measured with a genetic score called POLYEDU. It found that the average POLYEDU has been declining across 129,808 Icelanders, and it compares that decline with the Flynn effect (the rise in measured IQ over recent decades). The article uses it as a measured, small, ongoing genetic change in a trait tied to fitness. ↩
- 103.
Beauchamp, Jonathan P. “Genetic evidence for natural selection in humans in the contemporary United States.” PNAS. Jul 12, 2016. “my estimates imply a rate of selection of about -1.5 mo of education per generation (which pales in comparison with the increases in EA observed in contemporary times).” A study of natural selection in the contemporary United States, using the Health and Retirement Study of people of European ancestry born 1931–1953. It estimates selection against education at about 1.5 months per generation. The article cites it as one of two measured examples of ongoing genetic change in a fitness-related trait, and notes that such changes are far too small to see within a human lifetime. ↩
- 104.
Lynch, Michael. “Rate, molecular spectrum, and consequences of human mutation.” Proceedings of the National Academy of Sciences 107(3):961–968. 2010. A review by Michael Lynch, the author of drift-barrier theory, of the rate and kinds of new human mutations, estimated from databases of new mutations that cause single-gene disorders. It ends by estimating how fast human fitness would fall if natural selection were relaxed. Lynch holds that most of the human genome is not functional, so his estimate of harm is not inflated by a high functional fraction. Mirror: PMC
- 104a.
Page 966: “so it is likely that an average newborn acquires a total of 50 to 100 new mutations at the diploid level, a small subset of which must be deleterious.” ↩
- 104b.
Page 966: “Thus, with a complete relaxation of natural selection, the expected decline in fitness associated with mutations in coding DNA alone appears to be on the order of 1% to 3% per generation.” “Because the genetic effective population size of humans is now very large, the alleles contributing to our growing mutation load will remain at very low frequencies for many centuries, so the damage incurred under the scenario outlined earlier need not be permanent.” ↩ ↩
- 104a.
- 105.
Chen, Jia-Ling et al. “Allele frequency trajectories across age groups reveal ongoing natural selection shaping disease susceptibility.” American Journal of Human Genetics. Jul 24, 2026. A study that tracks how allele frequencies change across age groups, to see whether selection is still acting on disease-related variants. Of 509,817 variants tested, 168 are the ones it reports as signals of selection, and the method detects only effects large enough to shift an allele's frequency between age groups within one lifespan, so it shows selection is not zero but does not show that removal keeps pace with the arrival of new mutations. The article uses it to show that selection is still running on living people. ↩
- 106.
Gardner, Eugene J. et al. “Reduced reproductive success is associated with selective constraint on human genes.” Nature 603(7903):858–863. Mar 2022. “may only account for a very minor fraction of the overall likelihood of being childless (less than 1%).” A study in Nature linking reduced reproductive success with selective constraint on human genes, meaning genes that selection keeps from changing. The article cites it because the route to fewer children is behavioural, and no clinic addresses it. The authors qualify the genetic association in these words, quoted here so the article does not overstate the result: ↩
- 107.
Akbari, Ali et al. “Ancient DNA reveals pervasive directional selection across West Eurasia.” Nature 654:419–428. Apr 15, 2026. A study of ancient DNA from 15,836 people across West Eurasia spanning 18,000 years, compared with 6,438 modern individuals, that estimates selection at 9.7 million variants drawn from 8,074,573 single-letter DNA differences. The article cites it as the largest direct measurement of selection in human history, and it runs against a simple decline picture over the Holocene, the epoch since the last Ice Age. ↩
- 107a.
Their caveats, quoted because they matter: “There are caveats when interpreting signals of polygenic adaptation, especially for the three genetically correlated traits of scores on intelligence tests, household income and years of schooling. These traits are only relevant to modern societies and would have been unmeasurable in preliterate societies over the vast majority of the period during which selection acted.” “The signals are largely driven by selection before approximately 2,000 years [ago], after which γ tends towards zero.” They also estimate that. “only 2.16 (± 0.11)% ... of allele frequency changes are due to directional selection”. the rest being drift, migration and population structure. ↩
- 107a.
- 108.
Agarwal, Ipsita et al. “Relating pathogenic loss-of-function mutations in humans to their evolutionary fitness costs.” eLife 12:e83172. 2023. A study of 56,855 human exomes (the protein-coding parts of the genome) that estimates the fitness cost of losing a gene copy. Its median heterozygous fitness cost for a loss-of-function mutation is 0.018, and its mean is 0.058. The article cites it against its own interest: if a typical gene knockout costs nearly 2% of fitness, selection sees it at any plausible effective population size, so the article's argument has to live entirely below that. ↩
- 109.
Garcia-Erill, Genís et al. “Genomes of critically endangered saola are shaped by population structure and purging.” Cell. Apr 21, 2025. “In small populations, genetic drift leads to an increase in the mildly and slightly deleterious mutations, while purging reduces overall genetic load by removing the strongly deleterious recessive mutations that contribute the most to inbreeding depression.” “although we show that realized load increased over the last 10,000 generations in the saola, purging removed much of the genetic load that the species would have otherwise accumulated.” The authors caution that the elevated-deleterious-ratio pattern is disputed. A genome study of the saola, a critically endangered Vietnamese wild bovid (a hoofed, ox-like animal), by 34 authors, where purging means the removal of harmful recessive mutations by natural selection. The article uses it as its best single case: purging removed much of the load the saola would otherwise have carried, yet the load that actually gets expressed rose anyway over the last 10,000 generations. ↩
- 110.
Lavanchy, Eléonore et al. “Too big to purge: persistence of deleterious mutations in island populations of the European Barn Owl.” Heredity. 2024. “we found an increase in numbers of both neutral and deleterious minor alleles... but we found no evidence of purging.” “Only small populations with an effective population size of a few hundred or less can undergo purging... such small populations undergoing purging of highly deleterious alleles will usually also incur an additional cost of increased lowly and mildly deleterious mutations.” A genetic study of 502 European barn owls on islands, asking whether small populations can purge (remove) harmful mutations. Purging needs a small effective population size, meaning the number of breeding animals that would lose diversity at the same rate as the real population. The article uses it because it shows the limits of purging: island owls carried more of every kind of harmful allele, and the one route to purging comes with its own cost. ↩
- 111.
Aguilar-Gómez, Diana et al. “Genetic rescue of Florida panthers reduced homozygosity but did not swamp ancestral genotypes.” PNAS. 2025. “We found no differences in the total number of deleterious alleles per individual in Florida panthers before and after genetic rescue. Instead, a reduction in homozygosity seems to be driving improvements in fitness.” Loss-of-function alleles per individual rose (p = 0.006) while homozygous ones fell (p = 0.016). Homozygous means carrying two matching copies of a gene variant. Their simulations conclude: “this increase in fitness is transient, as fitness drops again within 20 generations.” A study of Florida panthers before and after genetic rescue, the adding of outside animals to a small population to bring in more genetic variety. It counts harmful alleles (versions of a gene) in the panthers and runs simulations of their future. The article uses it because the panther rescue is the famous success story, and this study shows it worked by masking harm rather than removing it. ↩
- 112.
Foote, Andrew D. et al. “Evidence of long-term purging of mutation burden in killer whale Orcinus orca genomes.” Heredity. Oct 28, 2025. No fitness was measured, and the authors attribute part of the signal to. “associative- or pseudo-overdominance”. A study of killer whale genomes that reports purging of non-synonymous mutations (changes to the protein a gene makes) as a class, not only the strongly harmful ones. It is the clearest published counterexample to the two-tier pattern the article describes. The article uses it because, if it holds, it reaches into the mild tier that the argument says selection cannot clean. ↩
- 113.
Kyriazis, Christopher C. et al. “Long runs of homozygosity are reliable genomic markers of inbreeding depression.” Trends in Ecology & Evolution. 2025. “empirical evidence for mutational meltdown occurring in wild populations remains scarce, thus its importance as a genetic driver of extinction remains in question.” A 2025 paper by three authors arguing that long stretches of matching DNA (homozygosity) are reliable markers of inbreeding depression, the loss of fitness that comes from breeding relatives. Its authors are the modellers whose distribution of fitness effects the saola study used. The article uses it as the strongest sentence against its whole thesis, because modellers say evidence for mutational meltdown (harmful mutations piling up until a population collapses) is scarce, and the article agrees for meltdown specifically. ↩
- 114.
Polishchuk, Leonard V. et al. “A genetic component of extinction risk in mammals.” Oikos 124(8):983–993. 2015. “remains poorly understood, particularly because of a strong and potentially masking effect expected from ecological traits”. Alexey Kondrashov, the author of the 1995 paper that this article's argument is largely built on, is a co-author, so the same person tests his own theoretical claim against comparative data twenty years later. The article uses it as the one cross-taxon empirical test of that claim, and the authors frame the difficulty this way: genetic factors' effect. ↩
- 115.
Mawass, Walid et al. “Extinction vortices are driven more by a shortage of beneficial mutations than by deleterious mutation accumulation.” Proceedings of the Royal Society B 293(2072):20260600. 2026. The comparison is between mutational meltdown, the build-up of harmful mutations, and mutational drought, the shortage of helpful ones. “In stable environments, we find that mutational drought is nearly as significant as mutational meltdown. Drought is more important than meltdown when populations must also adapt to a changing environment unless the beneficial mutation rate is extremely high.” A modelling paper from the Masel lab, the same lab as the fixation counts the article checks its arithmetic against. It asks what drives an extinction vortex, the cycle in which a small population loses fitness until it dies out, and its title gives the answer: a shortage of beneficial mutations matters more than harmful mutations piling up. The article uses it for the quoted finding that the shortage can matter as much as the build-up of harm. ↩
- 116.
Rupe, Christopher, and John Sanford. The Most Famous Evolution Experiment of All Time Shows that Evolution Goes the Wrong Way. FMS Foundation. Jul 2015. An eight-page essay, not peer reviewed, published by John Sanford's own foundation. It argues that Richard Lenski's long-term E. coli experiment shows adaptation by loss of function and is evidence for genetic entropy. Cited here for its reading of the experiment's fitness curve, which reverses the source it reproduces.
- 116a.
Closing summary paragraph: “In summation, the most famous evolution experiment ever conducted (LTEE) that is being proclaimed to the world as a dramatic proof of "observable evolution", is ironically one of the most powerful demonstrations of genetic entropy and de-evolution.” ↩
- 116b.
Page 3, figure 1: “The red line represents the best-fit curve using the power-law model, based on the complete data set over the course of 50,000 generations. It shows fitness has reached a near maximum and is not expected to significantly increase. The blue line represents an alternate way of interpreting the data (using the hyperbolic model) that is favored by Lenski and colleagues.” ↩
- 116a.
- 117.
Wiser, Michael J. et al. “Long-term dynamics of adaptation in asexual populations.” Science 342(6164):1364–1367. Dec 13, 2013. “Here, we examine fitness trajectories for 12 Escherichia coli populations during 50,000 generations. Mean fitness appears to increase without bound, consistent with a power law.” Fitness measurements on all twelve populations of Lenski's long-term E. coli experiment over 50,000 generations, compared against a bounded (hyperbolic) and an unbounded (power-law) curve. The power law fits better, and the authors derive it from clonal interference and diminishing-returns epistasis. It is the paper Rupe and Sanford's Figure 1 reproduces. Mirror: PubMed ↩
- 118.
Sanford, John C. Genetic Entropy. FMS Publications. 4th edition. 2014. The fourth edition of the book that launched the genetic entropy argument, by a Cornell plant geneticist turned young-earth creationist. Appendix 5 answers four objections, including why microbes and mice persist and why rare large beneficial mutations cannot offset the decline. Cited here for Sanford's own defence of the cap on beneficial effects.
- 118a.
Chapter Appendix 5, section Objection #2, Mega-beneficial Mutations: “In a genome with 3 billion units of information, the average beneficial mutation should only increase information by about one part in 3 billion.” ↩
- 118b.
Chapter Appendix 5, section Objection #2, Mega-beneficial Mutations: “In the presence of an antibiotic, the mutant strain lives, while all the other bacteria die. So fitness has not merely been doubled relative to the other bacteria, it has increased infinitely, going from zero to one.” ↩
- 118c.
Chapter 7, Artificial Rescue Mechanisms?, section The synergistic epistasis mechanism: “There is no reason to think that on a genomic level, the primary mode of interaction between mutations could involve synergistic epistasis. At least one paper provides experimental evidence against generalized synergistic epistasis (Elena and Lenski, 1997). To the extent there is a substantial amount of synergistic epistasis happening, it makes the genetic situation worse, not better.” “The synergistic epistasis mechanism has all the appearance of representing deliberate obfuscation.” ↩
- 118d.
Chapter Appendix 5, section Objection #1, Persistence of various forms of life disproves Genetic Entropy: “Importantly, in microbial systems there is selection after every cell division. So there are about 1,000 cycles of selection for every mutation that occurs. In man it is reversed – there is only 1 cycle of selection for every 100 mutations. These advantages make most microbes especially resistant to genetic entropy.” “For this reason, it is widely understood that RNA viruses are prone to error catastrophe and spontaneous mutational meltdown, and this is well documented.” “The answer is well known to microbiologists – viruses and bacteria can persist for very long periods of time in a dormant state and can re-emerge from "natural reservoirs".” ↩ ↩
- 118a.
- 119.
Carter, Robert W., and John C. Sanford. “A new look at an old virus: patterns of mutation accumulation in the human H1N1 influenza virus since 1918.” Theoretical Biology and Medical Modelling 9. 2012. “We suggest H1N1 has been undergoing natural genetic attenuation.” A computer analysis of over 4100 fully sequenced H1N1 influenza genomes, tracking how mutations built up from 1918 to the present. It reports two apparent extinctions of the human H1N1 lineage, in the 1950s and in 2009, which the authors read as the result of continuous mutation accumulation. The article cites it as a main creationist example of a virus decaying, and calls it the weakest argument in that case. The 2009 disappearance is of the seasonal human lineage, in the year a new H1N1 of swine origin swept the world; the authors read it as mutational extinction, critics as replacement by a strain to which few people were immune.
- 119a.
Abstract, Results: “We document multiple extinction events, including the previously known extinction of the human H1N1 lineage in the 1950s, and an apparent second extinction of the human H1N1 lineage in 2009. These extinctions appear to be due to a continuous accumulation of mutations. At the time of its disappearance in 2009, the human H1N1 lineage had accumulated over 1400 point mutations (more than 10% of the genome), including approximately 330 non-synonymous changes (7.4% of all codons). The accumulation of both point mutations and non-synonymous amino acid changes occurred at constant rates (μ = 14.4 and 2.4 new mutations/year, respectively), and mutations accumulated uniformly across the entire influenza genome.” ↩
- 119b.
Section Background: “Herd immunity is undoubtedly an important factor in reduced H1N1 mortality since 1918, but this may not be sufficient to explain the continuous decline in H1N1-related mortality over multiple human generations or the eventual extinction of the viral strain.” ↩
- 119a.
- 120.
Koelle, Katia, and David A. Rasmussen. “The effects of a deleterious mutation load on patterns of influenza A/H3N2's antigenic evolution in humans.” eLife 4:e07361. Sep 14, 2015. A modelling study by two mainstream influenza evolutionary biologists, combining simple models, a simulation of H3N2 spreading through a host population, and analysis of real H3N2 sequences. It finds that harmful mutations carried along with each new immune-escape mutation slow the virus's antigenic evolution and help explain the shape of its family tree. It is cited here because it takes the deleterious load in influenza as established and discusses openly whether H3N2 has declined in fitness since 1968. Mirror: PMC
- 120a.
Section Introduction: “several phylogenetic analyses have indicated that influenza A/H3N2 in humans carries a deleterious mutation load (Fitch et al., 1997; Pybus et al., 2007; Strelkowa and Lässig, 2012).” ↩
- 120b.
Section Materials and methods, Description and implementation of the phylodynamic model: “Our phylodynamic simulations required that a proportion of non-antigenic mutations were beneficial rather than deleterious because of the finite number of hosts we were computationally able to simulate. Specifically, in finite populations it is well known that the lowest-load mutation classes will at some point be stochastically lost, initiating Muller's ratchet (Muller, 1964). Recent work has indicated, however, that if a fraction of mutations are beneficial rather than deleterious, the average mutation load in a population can be maintained indefinitely over time (Goyal et al., 2012). In our simulations, we set εc to a value of 0.16, which resulted in a stable deleterious mutation load over time.” ↩
- 120c.
Section Discussion: “Returning to our model, given that an antigenic mutation arises in a strain carrying some deleterious mutation load, one might expect the virus population's deleterious mutation load to increase in the long run, causing a long-term decline in influenza A/H3N2 fitness. Two processes exist, however, that can keep this long-term accumulation of deleterious mutations from occurring. … The possibility that influenza A/H3N2 has been declining in fitness over time may, however, also be entertained: a recent virological analysis of human H3N2 viruses points towards a long-term decrease (since 1968) in the propensity of the virus to bind human sialic acid receptors (Lin et al., 2012). … Whether this finding can be interpreted as evidence for a 'weakening' of the virus over time is unclear, especially because 'weakening' by any epidemiological measure has not been empirically demonstrated.” ↩
- 120a.
- 121.
Paget, John et al. “Has influenza B/Yamagata become extinct and what implications might this have for quadrivalent influenza vaccines?” Eurosurveillance 27(39):2200753. Sep 29, 2022. Abstract: “While two influenza B virus lineages have co-circulated, B/Yamagata-lineage circulation has not been confirmed since March 2020.” A short surveillance report from the Netherlands Institute for Health Services Research (Nivel) and the Dutch National Institute for Public Health and the Environment (RIVM), reviewing WHO FluNet detections of influenza B after March 2020. It finds no confirmed B/Yamagata circulation since then, explains the sporadic reported detections as possible vaccine-strain or unconfirmed results, and calls for sequencing to settle whether the lineage is extinct. Mirror: PMC ↩
- 122.
Masel Lab. “MutationLoad.” GitHub. n.d. Retrieved Jul 25, 2026. “into discrete linkage blocks with numeric values summarizing combined mutation effects,”. The C simulation code behind the Matheson et al. study, published by the Masel lab on GitHub. Its README says it breaks genomes into linkage blocks with two recombination events per chromosome per meiosis, the same abstraction Mendel's Accountant uses, adopted independently by a mainstream lab. The article uses it because the Masel lab's independent adoption of the same design shows that the abstraction is legitimate. ↩
- 123.
Zachriel. “Comment on 'Mendel's Accountant again'.” The Skeptical Zone. Oct 1, 2015. A pseudonymous comment, number 85371 in the blog's comment thread, restating a 2009 analysis. The line at issue is Mendel's Fortran work_fitness(i) = work_fitness(i)/(randomnum(1) + 1.d-15). Dividing by a uniform (0,1) draw is equivalent to multiplying by a heavy-tailed variate with no finite mean, so the direction of the resulting bias is not obvious to either side. The article cites it only as the one located statement of the opposite direction, not as an authority. ↩
- 124.
JoeCoder. “Comment on 'Evolution Visualized'.” The Skeptical Zone. Sep 19, 2016. “I'm also no longer sure about the comment I made a year ago that selection in Mendel is 'TWICE as efficient as it should be.' It's possible I could be off by two somewhere due to haploid/diploid differences or something.” A reader comment on The Skeptical Zone, a website, posted by an online user named JoeCoder. In it the commenter withdraws an earlier claim about how strong selection is in Mendel (a population-genetics simulation program), and says the figure may be off by two. The article cites it in its discussion of the Mendel selection bug, where the direction of the error is disputed. ↩
- 125.
Gallet, Romain et al. “Measuring selection coefficients below 10-3: method, questions, and prospects.” Genetics. Jan 2012. “Our method allowed us to estimate mean selection coefficients to a precision of 2 × 10⁻⁴.” A 2012 paper that presents a method for measuring very weak selection. Its test case is three transposon insertions (pieces of DNA that move around a genome) in E. coli bacteria, measured by flow cytometry in very large populations with massive replication. It also found "cryptic variation" in s beyond what drift explains, "even in fully controlled experiments." The article uses its precision figure as the best ever achieved on a single selection coefficient. ↩
- 126.
Lind, Peter A. et al. “Variation in mutational robustness between different proteins and the predictability of fitness effects.” Molecular Biology and Evolution. Feb 2017. “This set-up allowed detection of fitness differences of |s| > 0.004.” A study that measured the fitness effects of 109 amino-acid substitutions in araCDE, sorting them into 17 with complete loss of function, 44 with partial loss, 44 neutral and 4 beneficial. Its set-up detected fitness differences only above |s| > 0.004, and anything smaller was scored neutral by definition. The article uses it for that limit: a typical distribution study resolves effects only above 0.004. ↩
- 127.
Montañez, George et al. “Multiple overlapping genetic codes profoundly reduce the probability of beneficial mutation.” Biological Information: New Perspectives, 139-167. World Scientific. 2013. A theoretical chapter in a creationist and intelligent-design symposium volume. The starting assumptions on pp. 141-143 specify a tunable 99.9% optimal fraction, independently chosen preferred letters across codes, and unit-sized effects. Equations 1-3 on p. 146 calculate net beneficial, harmful and neutral outcomes; a benefit need not improve every code. The chapter does not measure those inputs or establish an upper bound on whole-organism beneficial fractions from competition assays. ↩
- 128.
Sohail, Mashaal et al. “Negative selection in humans and fruit flies involves synergistic epistasis.” Science. May 5, 2017. “we detected underdispersion of the number of rare loss-of-function alleles in eight independent data sets from human and fly populations.” The effect is small: “σ² = 0.9V_A... appears, for example, after truncation of less than 2% of the population.” A study of human and fruit fly populations that looked for negative selection acting through synergistic epistasis, where the harm of one mutation depends on other mutations. The article cites it as the report of evidence for that proposal, from Kondrashov, Crow, and Eyre-Walker and Keightley, in humans and flies. ↩
- 129.
Saber, Sayran et al. “Evolution of the rate, molecular spectrum, and fitness effects of mutation under minimal selection in Caenorhabditis elegans.” Genetics. Mar 26, 2026. A mutation-accumulation experiment from Charles Baer's laboratory: 100 C. elegans lines kept under minimal selection for about 150 generations, each then split in two and run about 150 more, with genomes sequenced and 50 line families assayed for competitive fitness. Because the second round adds about as many mutations as the first, the design tests whether each new mutation costs more when the genome already carries many, which is what synergistic epistasis predicts. It found no sign of that.
- 129a.
Section Discussion: “This study provides no support for the possibility that deleterious mutations interact synergistically, and in fact the point estimate of the effect of second-order mutations (uO2) is about half that of the first-order effect, suggestive of diminishing returns epistasis.” Abstract: “Evidence for synergistic epistasis is famously inconclusive, although there is reason to think it may be more detectable under competitive conditions. However, a model of constant mutational effects on competitive fitness explains the results significantly better than a model including epistasis.” ↩ ↩
- 129b.
Section Discussion: “Whether the average interaction between deleterious mutations is multiplicative (no epistasis), synergistic (negative epistasis) or diminishing-returns (positive epistasis) has important implications for evolution, prominently including the evolution of sex and recombination (Barton 1995; Otto 2009), as well as the long-term existence of species with modest effective population sizes (e.g., humans, Kondrashov 1995; Charlesworth 2013b).” “The idea that epistasis among deleterious mutations should be synergistic on average has been as influential among evolutionary geneticists as the supporting evidence for it is weak (de Visser et al. 2011).” ↩
- 129a.
- 130.
Sayyed, Imran et al. “Additivity of the genetic load is a product of both synergistic and antagonistic epistasis in Drosophila.” bioRxiv. Nov 5, 2025. Abstract: “We observed an accelerating decline in pupal productivity with increasing inbreeding coefficient, consistent with synergistic epistasis, whereas pupa-to-adult viability exhibited a decelerating decline, consistent with antagonistic epistasis. This decoupling led to an overall linear decline in the production of adult offspring with increasing inbreeding.” A preprint, not yet peer reviewed, that inbred fruit flies by full-sib mating and tracked how two stages of fitness fell as inbreeding rose. Pupal productivity fell faster and faster, as synergy predicts; survival from pupa to adult fell more and more slowly, the opposite. The two cancel, so total adult offspring fall in a straight line. ↩
- 131.
Chebib, Jobran et al. “An estimate of fitness reduction from mutation accumulation in a mammal allows assessment of the consequences of relaxed selection.” PLoS Biology 22(9):e3002795. 2024. A mutation-accumulation experiment in a mammal, the first replicated one in a vertebrate, led by the senior author Peter D. Keightley. Keightley also co-authored Eyre-Walker and Keightley 1999 and Lesecque et al. 2012, so this is the same group on both sides of the argument. Their 0.38% is a hundredfold larger than the figure the article derives from fixation counts, because it includes segregating mutations that selection will eventually remove, while the article counts only what fixes permanently; the two numbers answer different questions and should not be compared without saying so. ↩
- 131a.
The confidence intervals overlap zero, which is why this is an estimate rather than a measurement, and the authors say so. The article cites it because a source that finds a decline and then declines to be alarmed by it is more useful to a skeptical reader than one that only does the first half. ↩
- 131a.
- 132.
Sanford, John C. Genetic Entropy & the Mystery of the Genome. Elim Publishing. 2nd edition. 2005. The second edition of Sanford's book, the version that made the argument widely known. Its chapter on whether the downward curve is real works the human decline forward from an assumed mutation rate and compares a 6,000-year history with a 6-million-year one.
- 132a.
Pages 149–150: “The actual rate for all types of mutations may be more than 600 per person per generation, and so given a diploid genome size of 6 billion, we should be losing about one ten millionth of our total information per generation (this number is not affected by what fraction of the genome is actually functional). … In 300 generations (6,000 years), if the rate of loss was constant and at its current level, we would lose about .003% of our total information. This is huge - (90,000 errors) - yet given the extremely robust nature of the genome, it is conceivable. However, if we continued to lose information at this same rate for 300,000 generations (6 million years) we would lose 3% of all our information! This would represent 90 million errors! This is inconceivable. No program could still be functional.” ↩
- 132a.
- 133.
This article's arithmetic. At U = 5 out of about 70 new mutations, about 7% of the 3.1 billion letters of a haploid genome are treated as constrained, about 220 million letters. The fixation table gives 1.11 harmful fixations per generation, so 333,000 over 300,000 generations, which is 333,000 / 220 million ≈ 0.15% of the constrained letters, or about 5 × 10⁻⁹ of them per generation. Sanford's 600 mutations in a 6-billion-letter diploid genome is 10⁻⁷ per generation, about twenty times faster. The two figures count different things: Sanford counts every new mutation in every person, and this article counts only harmful mutations that become fixed in the species. ↩