"The continents are being denuded at a rate that could level them in a mere 14 million years! Yet, evolutionary-uniformitarian geologists feel certain that the continents have existed for at least 1 billion years." — Stuart Nevins (Steven A. Austin), Institute for Creation Research, 19731
"A continent like North America would be worn down to low-lying terrain in geologically short times, of the order of ten million years!" — John Southard, MIT, in an undergraduate geology textbook2
"However, I am not sure that erosion rates are independent of the topography. Could it be, instead, that erosion rates are high at times of high relief (as today) but become much smaller as the continents approach peneplanation? This should be considered." — John Woodmorappe, reviewing the newest young-earth book on erosion for the Journal of Creation, 20243
Summary
Rivers carry roughly fifteen to twenty billion tonnes of rock into the ocean every year. Spread that loss evenly over the land and the continents lose about forty metres of height every million years. The land averages just under eight hundred metres above sea level. Divide one by the other and the continents should be flat in about twenty million years.
That calculation is correct. It is not a creationist invention, and no mainstream geologist disputes it — it appears in undergraduate textbooks as a standard puzzle. Young-earth writers have used it since 1973 to argue that the continents cannot be billions of years old.
The conclusion does not follow. The calculation measures how fast the land would vanish if nothing else were happening, and something else is very obviously happening. Three corrections apply, and they are of very different sizes:
- Continents float. Strip rock off the top and the crust rises to replace about five-sixths of what was removed. To lower the surface one metre you must erode roughly six. This is a factor of six. It turns twenty million years into about a hundred and thirty.
- Flat land erodes slowly. Erosion tracks relief, so the decline is exponential rather than linear. This is real and measured. It does not rescue the old-earth position either — run the exponential out and the continents are still gone long before four and a half billion years.
- Tectonics rebuilds the continents. This is the correction that does the work, and it is the one the young-earth version leaves out.
It is worth being exact about what the argument's best advocate actually concludes, because it is more modest than the version usually attacked. Fleming does not say erosion dates the earth. He says it constrains it, and he goes on using radiometric dating himself: "erosion of course doesn't give us an exact date, but it really does help us constrain the age of the Earth… I use radiometric dating, I understand it, I've used it to do stratigraphic correlations… but even when we're generous, erosion rates show that the rock record is hundreds or even thousands of times younger than the radiometric dates would seem to indicate."4
That is the claim this article disagrees with. The honest form of what the erosion data support is not "the earth is young" and not "the rock record is a thousand times younger than dated." It is "the earth cannot be tectonically dead" — which everybody already agrees with.
The evidence that continents are actively rebuilt is independent and measurable, and the single strongest piece of it is this: in every mountain belt on earth you can walk up to rocks that crystallised twenty to thirty kilometres underground. They are at the surface because that much rock was removed from over them. Erosion on the scale the young-earth argument demands is not a problem for mainstream geology. It is a mainstream prediction, and it has been confirmed by measuring the pressure at which the exposed minerals formed.
The thing that is actually surprising
The relief-dependence objection — the one that sinks the argument in its usual form — was not first raised by a skeptic. It was raised by a creationist, at a creationist conference, in 1986, in the printed discussion of a creationist paper. It was raised again, in the flagship creationist journal, in December 2024. Both times it was stated clearly. The first was answered once, in print, and then dropped; the second has not been taken up at all.
That, more than any measurement, is the story of this argument, and this article is largely about it.
What this article does
It works the arithmetic in the open using measured numbers, and shows which steps survive. Where a figure is computed rather than quoted, the computation is shown so a hostile reader can redo it. The mean elevation of the land, the area of the continents, the volume of rock above sea level, and the mean depth of the ocean used below were all computed for this article from the ETOPO 2022 global relief grid at sixty arc-seconds, using exact ellipsoidal cell areas.5
It takes the best available version of the young-earth case rather than the weakest. That version is Monte Fleming's — a working geologist at Loma Linda University who published a book on it and then laid it out across two episodes, about a hundred minutes in all, on Todd Wood and Paul Garner's podcast Let's Talk Creation in June and July 2024. Both episodes were transcribed for this article and are quoted throughout, with timestamps.
It grades both sides by the same standard, which means it also documents where the rebuttals are wrong. The most widely cited skeptical answer to this argument contains no numbers at all. Two popular university course pages that do give a number use one that is roughly ten times too small for the job. A common talking point — that modern erosion rates are inflated by farming — turns out to be far weaker than its users think, and Fleming is closer to right about it than his critics.
It follows citations back to their origins, which turns out to matter more than any new measurement. The man who supplied the argument's headline number published a correction to it four years later that cuts the natural rate by a factor of nearly three. The USGS paper both sides quote for the disparity between erosion and uplift says, in the same abstract, that there is ample time for continents to be planed flat — and works out the isostatic correction itself. And the ocean-sediment version of the argument turns on a single wrong denominator, which one number published in 2020 settles.
Finally, it says plainly where the young-earth case is strongest. The weakest part is the popular coastal-erosion version, though a narrower form of it survives and is stated here rather than buried. The strongest part is not about rates at all. It is about the flat, undisturbed contacts between rock layers supposedly separated by millions of years — and about a genuine double edge, since the same erosion rates that embarrass an old earth embarrass a one-year flood considerably more.
Every source it rests on is catalogued, with what each one measured and which way it cuts, in a companion page: the literature.
Where the argument comes from
The erosion argument has a clear paper trail, and following it matters, because almost every number in the modern version was measured by mainstream geologists in the 1950s and 1960s and has been passed hand to hand ever since.
1955-1964: the mainstream sets the numbers. James Gilluly estimated that 13.6 km³ of solid material reaches the world ocean each year.6 Stanley Schumm, in a US Geological Survey paper titled The disparity between present rates of denudation and orogeny, put modern mountain uplift at 7.6 metres per thousand years and noted it was about eight times the maximum rate at which erosion strips a landscape.7 Sheldon Judson and Dale Ritter measured sediment and dissolved load in United States rivers and got an average lowering of 6.1 cm per thousand years, or 61 metres per million years.8 None of these men were creationists. All three papers are still cited, and Schumm's turns out to matter enormously — see below.
1973: Stuart Nevins turns it into a young-earth argument. Writing in the Institute for Creation Research's Impact series under a pen name — he is Steven A. Austin, later of Grand Canyon and Mount St. Helens fame — Nevins added up every route by which material reaches the sea: 20.2 billion tons of suspended river sediment, 4.6 billion dissolved, 2.2 billion from icebergs, and smaller contributions from groundwater, wave erosion and wind, less a small loss to salt spray, for 27.5 billion tons a year. (His tons are short tons, which is 24.9 billion tonnes; the article's tables convert them.) He divided the mass of the continents above sea level by that figure and got fourteen million years. Then he asked the question that has been asked ever since: "Yet—miracle of miracles—the continents are still here and do not appear to have been eroded even one time!"1
Nevins's numbers have held up remarkably well, and that should be said loudly. His estimate of the volume of sediment on the ocean floor, 77 million cubic miles, converts to 3.21 × 10⁸ km³. The 2019 GlobSed measurement, built from modern seismic data, gives 3.37 × 10⁸ km³ — within about five per cent. His total flux, 24.9 Gt/yr once converted to tonnes, is in the same range as modern estimates. Redoing every calculation in the paper from his own inputs reproduces every one of his answers. There is no arithmetic cheat in the founding document, and no bad data.
The problem is structural, and Glenn Morton — who once made the argument himself — put it best. Dividing a stock by a flux gives you the time until the stock is exhausted, not the time since it began. A river two hours from the sea did not start flowing two hours ago. To turn "how long until the continents are gone" into "how long have the continents existed," you need a term for what puts rock back, and Nevins's calculation has no such term: no uplift, no isostatic rebound, no recycling.
1986-1988: Ariel Roth builds the careful version. Roth, of the Seventh-day Adventist Geoscience Research Institute, is the most rigorous writer in this tradition and the one everything later depends on. His Origins paper works through six independent rate arguments, quotes the mainstream literature accurately, states the standard counter-explanations, and answers them one at a time.6 A companion paper two years later supplies the second half of the case, about stratigraphic gaps.9 Roth's figures — 6.1 cm per thousand years, 623 metres of mean continental elevation, 10.2 million years to level — are the ones nearly every later creationist writer reuses.
1990s-2000s: it becomes a standard talking point. Tas Walker's Creation magazine article "Eroding ages" reproduces Roth's figures and examples almost line for line.10 It appears in ICR's "Four Geological Evidences for a Young Earth" and "Five Global Evidences," in Henry Morris's Scientific Creationism, and in Paul Ackerman's It's a Young World After All.
2021-2024: Monte Fleming. Fleming is Assistant Professor in the Department of Earth and Biological Sciences at Loma Linda University, with a PhD in earth science from the same institution. He is not a credential-free populariser, and it is worth saying so plainly before disagreeing with him. He has published original field and laboratory research in mainstream, non-creationist journals — two papers in Elsevier's Geomorphology on pothole formation and sediment removal by wind on Rock Window Mesa in Arizona, and one in the SEPM Journal of Sedimentary Research describing a precision sediment feeder he built for flume work.11 His master's thesis was on marine vertebrate burial in the Miocene Pisco Formation in Peru. He runs a sediment flume at Loma Linda designed to vary depositional parameters independently. His book Stories About Earth's History: A Geologist's Dissent from Deep Time — self-published in December 2021, fifteen chapters and about 121 pages — gives nine arguments against deep time, of which erosion is the first and longest.12 In June and July 2024 he presented it across two episodes of Let's Talk Creation, the podcast run by Todd Wood of Core Academy of Science and Paul Garner of Biblical Creation Trust.13 4 Those episodes are the most detailed public statement of the argument in existence, and this article treats them as the primary text.
2024-2026: the argument goes live again. John Woodmorappe — a pen name — reviewed Fleming's book for CMI's Journal of Creation under the title "A strange admixture of erosion geology and tendentious theology": warm on the geology, hostile to a theological digression in the book's closing chapter.3 In April 2026 Jake Ramgren wrote a popular version for the New Creation blog, opening with the lighthouses that have had to be moved back from the Cape Cod cliffs.14 In June 2026 the biologist Joel Duff answered him in detail.15 That exchange is the current state of the debate.
The arithmetic, done carefully
Start by granting the argument everything it asks for.
The mass. Land covers 148.5 million square kilometres and averages 794.5 metres above sea level. At a rock density of 2.7 tonnes per cubic metre that is 3.19 × 10¹⁷ tonnes of rock standing above the waterline. Both figures were computed for this article from ETOPO 2022.5 Fleming's own working figure, "about 800 metres tall on average," is right.13
The flux. Estimates of what rivers deliver to the ocean cluster between about 12.6 and 24 billion tonnes a year depending on what is being counted. The most useful single number does not come from river gauges at all. Hella Wittmann and colleagues measured cosmogenic beryllium-10 in sand from more than fifty of the world's largest rivers, covering 32% of the land surface. For the 65% of those rivers whose sediment is in cosmogenic steady state, the measured flux is 3.07 ± 0.56 Gt/yr, at a source-area denudation rate of 54 m/Myr. Scaling that rate up to all the world's exorheic basins — which is an assumption, and the authors say so — gives 15.2 ± 2.8 Gt/yr, averaged over the last eleven thousand years.16 So it is a pre-agricultural number, and it is anchored in measurement, but the global figure is an extrapolation like the others. It should not be presented as though it were not.
The division.
| Sediment flux | Where it comes from | Uniform lowering | Time to level |
|---|---|---|---|
| ~6.4 Gt/yr | Phanerozoic average, from preserved rock volumes | 16 m/Myr | 50 Myr |
| 9 Gt/yr | Judson's own pre-human estimate | 22 m/Myr | 35 Myr |
| 12.6 Gt/yr | modern flux past the world's dams | 31 m/Myr | 25 Myr |
| 15.2 Gt/yr | measured pre-human background | 38 m/Myr | 21 Myr |
| 19 Gt/yr | Fleming's sediment plus dissolved load | 47 m/Myr | 17 Myr |
| 24 Gt/yr | modern sediment plus dissolved load | 60 m/Myr | 13 Myr |
| 24.9 Gt/yr | Nevins's 1973 total, converted from short tons | 62 m/Myr | 13 Myr |
The range from present-day measurements is twelve to twenty-five million years. Fleming's headline figure of twenty-two million is correctly calculated from his inputs, and Nevins's fourteen reproduces exactly. Nothing is wrong with this arithmetic. A reader who came here expecting to catch a creationist in a calculation error will not find one.
Two rows in that table deserve attention, because they come from inside the argument's own source list.
The second is the more awkward. Sheldon Judson supplied the number the whole creationist tradition rests on — 6.1 cm per thousand years for the United States, published with Dale Ritter in 1964. Four years later, in American Scientist, Judson published a global figure that corrected for human activity, and the correction is large. As reported in Nature by B. Gregor: "man's intervention has increased the overall denudation rate from 9 to 24 billion tons a year."17 Judson's own estimate of the natural, pre-human rate is 9 Gt/yr — roughly a third of the modern figure, and about a third of what a creationist article citing him usually uses.
Ariel Roth, to his credit, reports this: he notes that "Judson (1968), while correcting for human activity, suggests 34 Ma for complete erosion of the continents," and the mass balance reproduces it — 3.19 × 10¹⁷ tonnes divided by 9 Gt/yr is 35 million years.6 Others have been less careful. Tas Walker's Creation article states that "the average height reduction for all the continents of the world is about 60 mm per 1,000 years, which equates to some 24 billion tonnes of sediment per year," and lists the uncertainties that would push that number up — unmeasured bed load, rare catastrophic events — without mentioning the one that pushes it down by a factor of nearly three, which is the human amplification the author of the number identified himself.
There is an older and cleaner measurement available too. Dole and Stabler's 1909 survey for the USGS, made before mechanised agriculture, put the United States at 783 million short tons a year of dissolved and suspended load. Their own stated result is "one inch in 760 years," which is 33.4 metres per million years — about half the Judson and Ritter figure. Recomputing from their tonnage using their own rock density of 165 lb/ft³ gives 33.6, so their arithmetic checks; at the 2.7 t/m³ used elsewhere in this article it would be 32.9.18
The top row is the odd one out and it matters. It is not an extrapolation of modern rates at all — it is the denudation rate implied by the volume of Phanerozoic sedimentary rock actually preserved, corrected for what was later eroded or subducted. Read from the rocks rather than from a river gauge, the average over the last half-billion years comes out at about a third of the present rate.19
It is also not a creationist number. Roth was scrupulous about crediting its origin: the ten-million-year figure, he notes, "has been a well-accepted figure" appearing in standard textbooks including Dott and Batten's Evolution of the Earth and Garrels and Mackenzie's Evolution of Sedimentary Rocks.6 It is still in textbooks. Joel Duff, arguing against the young-earth use of it, concedes the point without hesitation: "The mainstream geological literature openly states that if denudation were the only thing happening, the continents would have been planed flat many times over the span of geological history. This is not a creationist 'gotcha' that someone forgot to address. It is a standard chapter heading."15
The question is what the number means.
Correction one: continents float
Take a kilometre of rock off a continent and the continent does not stay put. Crust floats on denser mantle, and lightening it makes it rise.
The arithmetic is simple. If crust has density ρc and mantle ρm, removing a thickness h of rock lets the column rise by h·(ρc/ρm). The net drop of the surface is only h·(1 − ρc/ρm). With ρc = 2.75 and ρm = 3.30 g/cm³ that is 0.167 — about seventeen centimetres of lowering per metre of rock removed.
So levelling a continent whose surface averages 795 metres does not mean removing 795 metres of rock. It means removing about 4.8 kilometres, and multiplying the time by six.
| Sediment flux | Naive levelling time | With isostatic rebound |
|---|---|---|
| 12.6 Gt/yr | 25 Myr | 152 Myr |
| 15.2 Gt/yr | 21 Myr | 126 Myr |
| 24 Gt/yr | 13 Myr | 80 Myr |
Across plausible densities — ρc from 2.67 to 2.85 and ρm from 3.2 to 3.4 — the multiplier runs from 4.7 to 9.1. Six is the value at the central densities, not the midpoint of that range, which is nearer seven.
This is not a modern rescue invented to answer creationists. Schumm's 1963 USGS paper, the one the creationist literature has been citing for sixty years, says explicitly that isostatic compensation multiplies the time to plane a continent "by a factor of five or much more."7
Fleming knows about isostasy and describes it correctly with an ice-cube analogy: chip the top off a floating ice cube and the rest bobs up.4 His objection is that you cannot keep doing this because you run out of crust. Removing 4.8 km is about 12% of the area-weighted continental crustal thickness of 39 km, so the trick works about eight times and stops. (The run-out-of-crust objection is put to him by one of the hosts rather than raised by Fleming; the arithmetic here is this article's own.)
He is right that isostasy alone does not answer the argument. A factor of six turns twenty million years into a hundred and thirty. The earth is held to be 4.5 billion years old and the continents at least 2.5 billion. Isostasy closes about three per cent of the gap. Anyone who has answered this argument by saying "isostasy" and stopping has not answered it.
Correction two: flat land erodes slowly
This is Woodmorappe's objection, and it is a real effect with a large literature behind it. Erosion rate scales with relief. Franz Ahnert's study of twenty mid-latitude drainage basins found rates as low as 1.6 cm per thousand years in Texas and England. Against that, Menard reported about 100 cm per thousand years for the Himalaya, and Ollier and Brown about 1,900 cm per thousand years on a volcano in New Guinea — a spread of more than a thousandfold, all of it collected by Roth himself.6
If erosion rate is proportional to elevation the decline is exponential rather than linear: h(t) = h0·e−t/τ. Calibrating to the same numbers as above, and including the isostatic factor of six, gives a time constant of 128 million years. Then:
| Time elapsed | Mean land elevation remaining |
|---|---|
| 100 Myr | 364 m |
| 500 Myr | 16 m |
| 1,000 Myr | 0.3 m |
| 4,500 Myr | effectively zero |
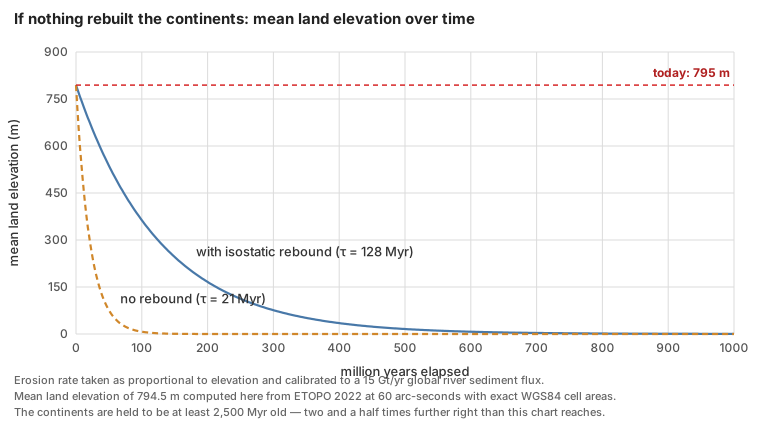
So the second correction does not rescue the old-earth position either. Exponential decay is gentler than linear at first and then merciless; a billion years flattens everything. This is worth stating plainly, because it is exactly where a careless defence of mainstream geology goes wrong. "Isostasy and diminishing returns" is not a sufficient answer, and a young-earth reader who has been fobbed off with it has been short-changed.
Correction three: something rebuilds the continents
Once the first two corrections are spent, only one option remains. If the continents are billions of years old and still stand most of a kilometre above the sea, then something must be actively putting rock back up. There is no way around this. It is also not a rescuing device: it is the central claim of plate tectonics, arrived at for entirely unrelated reasons decades before anyone applied it here.
The young-earth reply, made by Roth in 1986 and repeated by Fleming in 2024, is that this cannot be true because the evidence would be visible. Roth's version:
"It has been suggested that mountains still exist because they are constantly being renewed by uplift from below. However, this process of uplift could not go through even one complete cycle of erosion and uplift without eradicating the layers of the geologic column found in them. Present erosion rates would tend to rapidly eradicate evidence of older sediments; yet these sediments are still very well represented, both in mountains and elsewhere."6
Woodmorappe puts the same objection more sharply in 2024: "tens or perhaps hundreds of kilometre thickness of rock would have to be removed everywhere from every continent. There would be no Phanerozoic sedimentary rock left anywhere on Earth. Yet there are."3
This is the strongest form of the objection and it deserves a direct answer. The answer is that the prediction is correct and has been confirmed — but not everywhere at once, and the two halves of the objection describe two different places.
The refutation is already inside the creationist literature
Before the geology, a matter of record.
In August 1986, at the First International Conference on Creationism in Pittsburgh, Glenn Morton — then a young-earth creationist — presented a paper called "Geologic Challenges to a Young Earth." He endorsed the erosion argument, calling it "the best geological argument" available. The proceedings printed four signed responses. One of them, by John W. DeVilbiss, took the argument apart:
"It is true that if we take an empirical rate of erosion proportional to altitude, a differential equation leads to absurd initial heights for a 225 million year mountain chain. But the whole reasoning is not realistic. A mountain chain does not start out at maximum height. It 'grows' in the presence of erosion, and as it 'grows' higher, the erosion becomes exponentially greater… Thus, in the presence of erosion proportional to altitude, a mountain would never get unreasonably high even if very, very old."20
And then, in one sentence, the whole point:
"The balance is between growth, altitude and erosion rate, not merely between maximum altitude and erosion rate, as Mr. Morton and others have suggested."20
That is the coupled-system answer that mainstream geomorphology has given since Grove Karl Gilbert. It was published in a creationist venue, by a creationist, forty years ago, aimed squarely at the version of the argument creationist literature still runs today. No skeptic can dismiss it as an evolutionist talking point.
Thirty-eight years later, reviewing Fleming's book for the Journal of Creation, Woodmorappe raised the same objection again in the passage quoted at the top of this article, and then dropped it — "This should be considered." As of this writing nobody has taken it up in print, though the review appeared only in December 2024 and online in April 2026, which is not long for a quarterly.
Three things follow, and they do not all point the same way.
In fairness to Morton, his 1986 reply was not stupid. He answered DeVilbiss by pointing at the Appalachians:
"Most authorities would also agree that the Appalachians have not experienced significant uplift since the terminal Paleozoic orogeny… Since that time there has been no significant orogenic activity in the Appalachians and the subsequent history of the mountain chain has been one of erosion. Thus Dr. DeVilbiss' argument falls since the Appalachians have been experiencing little but erosion for 200 million years (in his view), and applying an increase in the erosion rate as the mountains were taller in the past is a perfectly valid approach to the problem and leads to absurd results. Thus the Appalachians could not be 200 million years old."21
DeVilbiss's answer works for a growing orogen — the Himalaya, the Andes, Taiwan. It does not obviously work for a mountain range that mainstream geology says stopped growing. That is the live crux, and it is dealt with below.
And credit where it is due, because this article's whole standard depends on noticing it. In the second podcast episode, unprompted and against his own argument, Fleming retracts one of his own book's numbers:
"I did make a mistake in the book, because I assumed equivalent density. And when I actually went and dug into that later, the sediment that collects behind dams is not compacted like the sedimentary record on the continents is, and so the actual mass is about one in five million."4
A self-published author volunteering an arithmetic error that weakens his own case, on the record, is exactly the behaviour this article is about to say the movement needs more of. It should be said before the criticism, not after.
But the larger record still stands. The relief-dependence problem has been identified twice, in print, inside the movement, by people arguing in good faith, and neither time did the argument change. It has never been placed on Creation Ministries International's list of arguments creationists should not use, nor on Answers in Genesis's equivalent — both lists were checked in full for this article, and neither contains any entry on erosion, denudation, ocean sediment, sea salt, deltas, or Niagara Falls.
That matters, because there is a precedent for how these organisations retire a bad clock. In 1993 Andrew Snelling and David Rush spent forty pages in a creationist journal killing the moon-dust argument, on the ground that its input figure was wrong by three orders of magnitude:
"Should creationists then continue to use the moon dust as apparent evidence for a young moon, earth and solar system? Clearly, the answer is no. The weight of the evidence as it currently exists shows no inconsistency within the evolutionists' case, so the burden of proof is squarely on creationists…"22
"We, of course, take responsibility for the conclusions, which unfortunately are not as encouraging or complimentary for us young earth creationists as we would have liked."22
The erosion argument has not received that treatment. It should. The test Snelling and Rush applied is exactly the right one: is the input rate measured, is it representative, and has the removal or compensation term been accounted for? For erosion the answers are yes, roughly, and no.
The coastal version, which is the weakest
Fleming's opening move, and the one that has spread furthest, is not about denudation at all. It is about coastlines.
The observation is real and vivid. Lighthouses on the American east coast have had to be picked up and moved inland. Houses fall off cliffs in Florida and Alaska and on the shore of Lake Michigan. Coastal erosion costs the United States around half a billion dollars a year in property. Fleming's numbers, given on the podcast: the east coast retreats at "about a meter a year," the lighthouse-relocation record works out to about two feet a year, and the west coast runs at "a few centimeters per year."13
The book's figures are cleaner, and two reviewers quote them: the Atlantic coast retreating at 78 cm a year and the Pacific at 20 cm a year. Neither review states the time unit, but the arithmetic settles it. The two coasts close on each other at 0.98 metres a year, and dividing a continental width of about 4,100 km by that gives 4.2 million years, which is his answer, with the Pacific front travelling about 850 km inland — near Salt Lake City, where he says it lands. So the figures are annual rates of shoreline retreat and his arithmetic is self-consistent. It is worth noting that the coast-to-coast width he would need is at the narrow end: the 2,800 miles usually quoted, and used in the popular version of his own argument, is 4,500 km and would give 4.6 million years.
Then the extrapolation:
"So if we take these values — a meter a year, several centimeters per year — and then kind of extrapolate what should happen over a few million years, the United States is, you know, a few thousand miles wide, and it would only take about a little over 4 million years if sea level didn't change, and if the ground didn't move and any of that — it'd only take about 4 million years to just kind of level everything. Now, again, that is simplistic, because there are these other factors in play. But yeah, but even even so, I mean, that is remarkably rapid."13
The emphasis is added, and it matters. Fleming attaches the two conditions and flags the simplification in the same breath. Any version of this article that quoted him without them would be doing precisely what it criticises others for.
And the closing move, which is the one that does the real work: continental shelves are only a few tens of kilometres wide, so very little coastal erosion can ever have happened.
This version has five problems, and they compound.
It measures the wrong direction. Continental denudation is a vertical quantity — how much elevation the whole surface loses. Coastal retreat is horizontal — how fast a line moves sideways. They are not convertible, and a continent is not "levelled" by its edges moving inward; it is levelled by its surface coming down. Duff states it exactly: "The relevant quantity is not how many miles of coastline retreat per year. It is how many millimeters of elevation the whole surface loses per year. Geologists have a word for this: denudation."15
It uses the wrong substrate, and the wrong number for it. A metre a year is not a rate at which rock erodes. Rates like that come from unconsolidated material — sandy barrier islands, and the glacial sand and till that make up Cape Cod, which the Laurentide ice sheet dumped there about twenty thousand years ago. Fleming himself gives the reason the west coast is slower — "the rock type that the waves encounter matters a lot"13 — and then runs the extrapolation on the fast number anyway.
The measured numbers for actual rock are much lower, and they are available. The global database of rocky-cliff recession rates, GlobR2C2, holds 1,680 records from 1,530 sites, and its medians are 2.9 cm/yr for hard rock, 10 cm/yr for medium, and 23 cm/yr for weak rock — with chalk classed as weak.23 The United States Geological Survey measured California's coastal cliffs across 17,653 transects and got a statewide average of 0.3 ± 0.2 m/yr, or 17.7 metres of retreat over the seventy-year record.24 Fleming's east-coast figure of a metre a year is roughly twice the USGS long-term average for sandy Northeast and Mid-Atlantic shoreline, and about thirty-five times the global median for hard rock.
Where do the book's figures come from? Fleming says, on camera, and the answer matters more than any objection this article could raise.
"North America East Coast is about a meter per year — that's the last figure, the last figure I pulled off of the top Google search was 1.2, before that it was 0.8, average is about a meter."25
And a year earlier, giving the same argument: "…divide that number by 1.25, which is the average erosion rate according to Google at the moment."26
The 0.8 m/yr he names as his previous figure is the book's 78 cm. So the load-bearing input of the most widely repeated young-earth erosion argument of the last five years is a search-engine result, which changed underneath its author from 0.8 to 1.2 m/yr, and which he handled by averaging the old snippet against the new one.
He is not hiding this. He says "according to Google at the moment" on the record, twice, a year apart, and the book itself ends its chapter on continental erosion with a list headed "Search terms:" — nine questions to type into a search engine, plus "(Check Google Earth for the canyons.)" That is the citation method, stated openly. Six of the nine footnotes in that chapter point to popular web pages rather than to literature.
This should be said plainly and without sneering, because the alternative charge was worse and this article was about to make it. Fleming's 20 cm/yr Pacific figure happens to match a specific USGS number exactly — the average over the eroding transects only, in a report whose net California trend across all 14,562 transects is +0.2 m/yr, accretional.27 On the evidence now available that resemblance is a coincidence of round numbers, or Google repeating the erosion-only average; it is not Fleming selecting a subsample. The real criticism is simpler and he supplies it himself: a number that moves by fifty per cent between searches is not a measurement, and no amount of correct arithmetic downstream can repair it.
There is a further detail in the rocky-coast database worth knowing, because it points the same way. On France's systematically surveyed rocky coastline the national inventory could not detect retreat slower than 10 cm/yr, and reported no measurable retreat at all on most sections — "these null values represent 67% of the studies of rocky coasts." The published median of 2.9 cm/yr is computed after those sections are deleted. Two-thirds of surveyed rocky coast is eroding too slowly to measure over seventy years of aerial photography.
It assumes sea level has always been here. It has not, and Fleming knows it. Sea level swings roughly 120 metres through the ice-age cycles, and it has been near its present height for only the last few thousand years. For most of the Quaternary the shoreline was tens to hundreds of kilometres seaward of where it is now, out on what is today the continental shelf. Wave attack has not been grinding at one line; it has been sweeping back and forth across a broad zone.
This is not an objection Fleming failed to anticipate. He states it himself, correctly, in the middle of the same episode:
"One takeaway is that because the sea level is only thought to have been close to its current level for a few thousand years, over the last 300,000 years, most of the coastal erosion for this period would have happened down on the shelf and not at the current coastline."13
He then concedes more:
"So at least for part of the Pleistocene and the Holocene, it looks like the mainstream geomorphological narrative of the California coast is fairly coherent."13
Having granted that the mechanism spreads erosion across the shelf rather than concentrating it at the modern shoreline, and that the mainstream account of the last three hundred thousand years holds together, he goes on to apply a single-line retreat rate across fifty million years anyway. That is the pivot on which the argument turns, and it is made in the space of two minutes.
The size of the effect he conceded is worth putting a number on. Sea level at the last glacial maximum was 134 metres below present, and reached its current height only within the last few thousand years.28 On the 0.1-degree shelf gradient Fleming himself uses, a 134-metre drop moves the shoreline about 77 kilometres seaward. That is comparable to, or larger than, the entire shelf width he says is available — which means the sea has spent the Quaternary sweeping across the whole shelf rather than grinding at one line, and the shelf is exactly where you would expect the erosion to have gone.
Historic rates also demonstrably overstate long-term ones, and this has been measured at the rock face. Martin Hurst and colleagues sampled beryllium-10 in flint nodules across the shore platforms below the chalk cliffs at Hope Gap and Beachy Head in East Sussex. The isotope inventories require retreat of 2 to 6 cm/yr for most of the Holocene, against historically observed rates of 22 to 32 cm/yr — an acceleration of about an order of magnitude within the last few centuries, which they attribute mainly to the thinning of the protective beaches at the cliff foot.29 The bias runs one way: thicker past beaches would mean less isotope accumulation, so correcting for them makes the long-term rate slower still.
In fairness, that acceleration is not universal. At Hartle Loup in Yorkshire the same technique found retreat steady at 4.5 ± 0.63 cm/yr over seven thousand years, statistically indistinguishable from the 2.7 ± 2.9 cm/yr measured by monitoring over seven years.30 Anyone who wants to answer the coastal argument by saying "historic rates are always inflated" is going beyond the data.
It misreads the continental shelf. Fleming treats shelf width as a budget: the shelf is what is left of the eroded continent, so a narrow shelf means little erosion has happened. But the shelf is not an erosional stump. It is a constructional platform — a wedge of sediment built outward, which is why passive margins like the American Atlantic carry sediment piles kilometres thick. Its outer edge sits at about 130 metres depth because that is roughly where the sea stood at the last glacial maximum. The shelf is not the continent's corpse; it is where the continent has been putting the eroded material. This article's own ETOPO computation puts the world's shelf area between 0 and −200 m at 26.3 million square kilometres — about 18% of the land area, and not a small remnant of anything.
Cliff retreat is self-limiting. As a sea cliff retreats it leaves a shore platform behind it. The wider that platform gets, the more wave energy is spent crossing it before reaching the cliff toe, so the retreat slows. A rate measured today, on a platform that has only existed since sea level stabilised a few thousand years ago, is the fastest that system will ever run. Extrapolating it is like timing the first minute of a cooling cup of coffee and predicting when it will freeze.
And Fleming's own best evidence dates the coast. The most striking thing he shows on the podcast is a photograph of the marine terraces on San Clemente Island — a staircase of old wave-cut platforms lifted hundreds of metres above the sea, each one a former shoreline. He walks through a published reconstruction correlating those terraces with the sea-level curve, re-measures the figure himself, and reports that it holds up:
"It kind of actually nailed it. So it shows that their diagram was actually quite good, even zoomed in perhaps closer than they thought anyone would ever zoom into it."13
"Another takeaway would be that if the diagram is correct, an uplift rate over the last 300,000 years is roughly steady. So that adds coherence to the story."13
A staircase of dated shorelines is a record of hundreds of thousands of years of coastal history, checked by an independent sea-level curve, and it survived being re-measured by a hostile reader. It is hard to see how that evidence is supposed to support a coast a few thousand years old.
Fleming's own source criticism, graded. He spends several minutes on the satellite study that reports the world's beaches to be roughly stable — 24% eroding, 28% accreting, 48% stable, with a net global gain of 0.33 m/yr.31 Three of his four objections are good ones. The study really does cover only sandy shoreline, which is 31% of the world's ice-free coast, and his figure of "about 31%" is exactly right. It really does exclude sea cliffs, which can only retreat. And the accretion really is concentrated at river deltas and at artificial land reclamation — the paper concedes this itself, noting that "two large-scale land reclamations appear in the top seven accretive beaches in the world," and that Asia's strongly positive mean is "likely due to the artificial development of the Chinese coast."
His fourth objection is wrong, and specifically so. He says the measurements have a resolution of "about 0.5 metres," so a global mean of +0.33 m/yr is below the noise floor. The paper's actual positional accuracy is about half a Landsat pixel — 15 metres, not 0.5. The 0.5 m/yr figure he is reaching for is a rate class boundary, derived from 15 m of position over 30 years, not a resolution. And because each transect's rate is a regression through up to thirty-three annual shorelines rather than a difference between two images, the uncertainty on the trend is much smaller than the positional error: the authors report that over 60% of their 2.2 million transects have an uncertainty band under half the trend. The error runs in the direction that would help him if it were true — a 15-metre positional error sounds worse for the study than a half-metre one — so this is a misreading rather than a thumb on the scale. What actually answers the objection is the regression: because each transect's rate is fitted through up to thirty-three annual shorelines rather than differenced between two images, the uncertainty on the trend is far smaller than the uncertainty on any single position.
One caution about the arithmetic in the popular version. Jake Ramgren's 2026 blog post takes the three-feet-a-year Cape Cod figure, divides 2,800 miles of continent by it, and gets five million years; the arithmetic is right on its own assumptions. It also attributes to Fleming a claim that the crust would need to be raised fifty kilometres on the west coast and four hundred on the east, "the same height above sea level as the International Space Station."14 Those figures come from feeding a horizontal coastal-retreat rate into a vertical uplift budget. Duff's verdict is correct and this article endorses it: "The '400 kilometers' is not a finding about geology. It is an artifact of the wrong input, and a model is only as trustworthy as the number you feed into it."15
The shelf-width clock
There is one more version, made in Fleming's own videos rather than on the podcast, and it is the most striking thing in the whole argument because it looks like a successful prediction.
He measures the width of the continental shelf in Google Earth, averages the American east coast at 131.8 km, divides by his 1.25 m/yr retreat figure, and gets 105,440 years. He repeats it for the west coast, with its much narrower shelf and much slower rate, and gets 105,158.7 years. The two independent coasts agree to within 281 years out of a hundred thousand. His conclusion: "one obvious interpretation of this data is that Pangea split up only thousands of years ago."26
The agreement is real arithmetic and it means nothing, for a reason that has nothing to do with geology. Both inputs are known to two significant figures at best — one of them is a search-engine snippet that he watched change by fifty per cent. Two quantities each uncertain by tens of per cent cannot produce a quotient reliable to four significant figures. The 281-year match is not a measurement agreeing with a measurement; it is a coincidence of rounding presented at a precision the inputs cannot carry. Had he propagated the uncertainty, both answers would read as "roughly a hundred thousand years, give or take a factor of two," and the striking agreement would disappear.
What the calculation actually shows is that the two coasts' shelf widths happen to stand in about the same ratio as the two coasts' quoted retreat rates — roughly six to one. There is a simpler reason for that than a common start date: the east coast is wide and soft, the west coast is narrow and hard, and both facts follow from one being a passive margin and the other an active one. Substrate and tectonic setting control both numbers, so the ratio carries no information about elapsed time.
The version of the coastal argument that survives
The popular form should be dropped. But something narrower does survive, and it would be dishonest to close the section without printing it.
Grant the tenfold historic-to-millennial correction. The best-measured millennial rates for rocky coast are still 2.6 to 5.7 cm/yr at Sussex and 4.5 cm/yr at Yorkshire. Over ten million years those put 260 to 570 kilometres of retreat on a rocky coastline. Over the two hundred million years assigned to the American Atlantic margin, the global hard-rock median of 2.9 cm/yr gives 5,800 kilometres — wider than North America. That number is enormous and it should be printed rather than buried.
Reconciling it requires the true long-term rate to be another one to two orders of magnitude slower still. There is now direct evidence that such rates exist: measuring beryllium-10 in the debris shed off cliffs, rather than on the platform below them, gives millennial retreat of 0.3 to 0.6 mm per year on Mediterranean and Peruvian coasts — fifty to a hundred times slower than the published global median.32 At that rate a coast retreats only thirty to sixty kilometres in a hundred million years, which is the same order as a real shelf width, and the problem closes.
But that result rests on eleven samples from two low-energy coasts. It is not yet a global measurement. So the fair statement is this: the mainstream account of rocky coastlines over deep time depends on a rate correction that is real, is measured at a handful of sites, and has not been established globally. A skeptical geomorphologist would accept that framing. It is a much smaller claim than "erosion proves the earth is young," and it is the only part of the coastal argument that a careful reader should still find interesting.
There are also three mechanisms that make slow long-term retreat physically expected rather than merely convenient. A retreating cliff leaves a widening, shallowing platform that dissipates wave energy before it reaches the cliff toe. The debris it sheds becomes a beach that armours it — and modelling shows a rocky coastline can settle into a stable plan-view configuration of headlands and bays through that feedback alone, with no uplift and no difference in rock hardness.33 And of the four feedback loops identified in cliff backwearing, three are self-limiting — wave-energy depletion at the cliff toe, pore-pressure reduction, and protection by the cliff's own debris — against one that reinforces, abrasion.34
Where both sides have been sloppy
Grading only one side would be dishonest, and the rebuttal literature turns out to be in worse shape than its confidence suggests.
The most-cited skeptical answer contains no numbers. Mark Isaak's Index to Creationist Claims is what nearly every later rebuttal is downstream of. Its entry on mountain erosion answers a quantitative argument with three assertions and not a single figure: new mountains are being built, present rates are unusually high, and the claim contradicts another creationist claim about volcanism.35 The second point is a factual claim about earth history offered with no citation. The third is an observation about creationist consistency, not about the earth.
Two widely-copied university pages use a rate that is ten times too small. A course site at the University of South Dakota and a physics-outreach page both put continental erosion at 0.005 mm/yr and then declare the creationist budget baseless.36 Whether one copied the other could not be determined, and the South Dakota page attributes its figure to a book by Hugh Ross rather than deriving it. That figure is close to the median rate for bare rock outcrops — 5.4 m/Myr in the global compilation — not the median for drainage basins, which is 54 m/Myr and is the relevant quantity for a whole-continent sediment budget.37 Using the outcrop number makes the problem disappear by arithmetic sleight rather than by physics.
The "modern rates are inflated by farming" reply is much weaker than its users think, and Fleming is closer to right about it. Asked on the podcast whether human activity accounts for the discrepancy, he answers: "the estimates that I've seen is that maybe it's twice as high, so it's not the orders of magnitude that you need."4 Three separate lines of evidence say he is substantially correct for the quantity his own calculation uses.
- Cosmogenic beryllium-10 measures the pre-human rate directly, because the isotope inventory is set tens of centimetres down and integrates over thousands of years. Two centuries of ploughing is a rounding error in that window. As Portenga and Bierman put it, "shallow, human-induced soil erosion does not typically affect cosmogenic estimates of basin-scale erosion rates."37
- The measured pre-agricultural global flux from that method is 15.2 Gt/yr against 24 Gt/yr for the modern sediment and dissolved load reaching the ocean — a factor of about 1.6, not a factor of a hundred.16
- Where the hundredfold figure is real, it does not do the work people want. In the southeastern United States, peak post-settlement hillslope erosion ran about 950 m/Myr against a beryllium-10 background of about 8 m/Myr — more than a hundredfold. But river sediment yields over the same basins rose only five- to tenfold, because the rivers were carrying only about six per cent of the eroded material; the rest is still sitting at the bottom of hillslopes and in valley floors.38
The flux that matters for "how fast is the continent losing mass" is the flux that leaves the continent, and that one has roughly doubled, not multiplied by a hundred. Anyone rebutting this argument by pointing at agriculture is overstating their case.
The reason the two numbers differ so wildly is geographical, and Wilkinson and McElroy state it in one pair of sentences: about 83% of the global river sediment flux comes from the highest ten per cent of the earth's surface, while about 83% of cropland erosion happens on the lowest sixty-five per cent.19 The natural sediment machine is mountains. Agriculture is on the plains. They barely overlap, so ploughing a great deal of flat land multiplies hillslope soil loss enormously and moves the global export figure hardly at all.
The same paper supplies a number that does more work than anything else in this section, and it is not derived from modern rates at all. Reading the Phanerozoic sedimentary rock record itself — the volume of sediment actually preserved, corrected for later erosion and subduction — Wilkinson and McElroy get a mean continental denudation rate over the last half-billion years of 16 metres per million years, with epoch-by-epoch values ranging from about 4 m/Myr in the Middle Triassic to about 53 m/Myr in the Pliocene. That is a rate measured from the rocks, not extrapolated from a river gauge, and it is roughly a third of the present-day figure.
Put it through the same arithmetic and the continents level in about fifty million years without isostasy, or three hundred million with it. This does not rescue an old earth by itself, and this article will not pretend it does. What it does show is that the present is not a good guide to the Phanerozoic average — which is a point creationist and mainstream writers can agree on, arrived at from the rock record rather than from anybody's model.
In steep terrain the bias runs the other way entirely. In thirty-two Idaho catchments where the Forest Service had been gauging sediment for decades, cosmogenic rates came out on average seventeen times higher than the gauged rates, because most sediment moves in rare events no gauging programme is likely to catch.39 The same paper found that 70 to 97 per cent of sediment delivery must happen in episodes too infrequent to be measured conventionally — a result creationists could legitimately cite, and generally have not.
One defence that sounds good and does not work. Measured geological rates famously get slower as the measurement window lengthens — Sadler's effect — so it is tempting to answer the erosion argument by saying that any short-term rate overstates the long-term one. That defence has to be given up here. Sadler himself, with Douglas Jerolmack, reports that upland denudation rates derived from sediment yield show little or no dependence on the measurement interval, and that the global sediment flux to the oceans has been roughly constant from months to tens of millions of years.40 A 2024 compilation of about 6,400 measurements finds no timescale dependence in fluvial erosion rates at all, apart from an artefact specific to the cosmogenic method.41 The effect is real for accumulation at a single locality; it is not a licence to discount continental denudation.
The ally this article leans on hardest is not exempt either. Joel Duff's reply to the coastal argument is the best short answer in print and is quoted here four times, but two things in it should not be repeated. His stated range of ten to twenty-five million years for planing North America does not reproduce from his own inputs — six hundred metres divided by his own 20 to 60 m/Myr gives ten to thirty. And his claim that isostatic uplift on passive margins like the American east coast runs at "fractions of a millimeter to a few millimeters per year" is uncited and appears to be wrong in sign for the coast under discussion: much of the mid-Atlantic margin is subsiding, at one to two millimetres a year, as the glacial forebulge collapses. That matters, because uplift on passive margins is precisely the mechanism his argument and this one both need.
And the creationist side has misused its own best source. In a 2019 ICR article, Jake Hebert cites Schumm's 1963 USGS paper in support of the erosion argument, and dismisses episodic uplift and isostatic compensation as "imagined rescuing devices."42 Both of those devices are argued for, quantitatively, inside the paper he is citing: Schumm's entire thesis is that uplift outruns denudation by roughly eightfold, and Schumm states that isostatic compensation multiplies peneplanation time "by a factor of five or much more."7 A reader who follows the citation finds the opposite of what it was offered for.
A second ICR article, by Brian Thomas, describes beryllium-10 as "an isotope of the element beryllium that becomes radioactive with exposure to the sun."43 Beryllium-10 is produced by cosmic-ray spallation, not by sunlight, and nothing "becomes radioactive" by being illuminated. It is the kind of error a hostile reader finds in thirty seconds, and it is on our side of the ledger.
The double edge
Here is the part that ought to worry a young-earth reader most, and it was first pointed out by a creationist.
In the same 1986 paper where Glenn Morton called continental denudation "the best geological argument" for a young earth, he added this:
"However, the young earth creationists, like the old earthers, have generally ignored the problem presented by these same erosion rates when regional unconformities are discussed."20
The point is simple, and only one person has seriously taken it up. Michael Oard's answer, across a four-part series in the Journal of Creation, is that the kilometres of continental erosion happened during the receding phase of the Flood rather than at present rates — on his own accounting, present processes have removed an average of only 0.275 m from the continents in 4,500 years. That is a real answer and it is the right shape of answer. What it costs is the argument this article is about: if present rates are unrepresentative by three orders of magnitude, they cannot also be used to date the continents. If observed erosion rates are the yardstick, they have to be applied everywhere — including inside the rock sequence that flood geology says was laid down in a single year.
Morton's own example came from seismic data he had worked with professionally. Beneath the coastal plain of the southern United States lie buried Appalachian folds ten to twenty thousand feet high, with up to ten thousand feet planed off their tops, and then twenty-five hundred feet of undisturbed Cretaceous strata lying flat across the truncated surface. Using the fastest erosion rate in his own list — 7.5 feet per thousand years, from the Transverse Ranges of California — stripping that ten thousand feet takes 1.3 million years.20 That is one erosional episode, in the middle of the sequence, on the most generous rate available, and it does not fit in a year.
The problem gets worse when creationist authors state their own erosion requirements. Andrew Snelling and Tom Vail put the volume removed from the Colorado Plateau at 400,000 km³ over an area of 647,000 km² — which works out to 618 metres of rock stripped off the whole plateau, in or shortly after the flood year.44 At the global background rate of 38 m/Myr, that is sixteen million years' worth of erosion. Their own figure, incidentally, is sourced not to a measurement but to another creationist popular book.
And the same arithmetic runs in the depositional direction. Timothy Helble, a retired hydrologist, took Steven Austin's own numbers for the Coconino Sandstone — 42,000 km³ of sand, a source boundary 1,600 km long, and about twelve days available for it within the early-flood window on Austin's own proportional accounting — and asked what sediment transport rate would be needed. He then granted flood geology a transport rate of 30 kg per second per metre of front, ten times the highest value on the published curve, and ran it for the full twelve days across the entire 1,600 km boundary. The result is 26 km³ of sand. The requirement is 42,000 km³. The most generous assumptions available deliver one part in sixteen hundred of what the model needs; at that rate the Coconino takes about fifty-three years.45
Helble also quotes a 1994 paper by six leading flood geologists conceding the underlying difficulty in print:
"It may not be possible to derive all the Flood sediments from igneous and/or metamorphic precursors by physical and chemical processes in the course of a single, year-long Flood."45
Joel Duff puts the resulting bind in one sentence, and it is the sentence this whole section exists to make:
"You cannot simultaneously argue that observed erosion rates prove the earth is young and that observed erosion rates are a misleading remnant of a vanished catastrophe. One of those claims has to go."15
That is exactly right, and it is a problem of the argument's own making. The erosion argument works only if present rates are representative of the past. Flood geology works only if they are wildly unrepresentative of the past. Running both at once is not a strong position held twice; it is one position that cancels the other.
There is a published reply, and it concedes the point. A 2025 presentation at the International Conference on Creationism is titled "Helble's Critique of Creationist Research on the Coconino Sandstone Fails." It was obtained and read for this article. Three things about it matter.
It is a one-page conference abstract rather than a paper — no figures, no equations, four references — and its authors call it "an initial critical response." Its lead author, John Whitmore, edited the proceedings volume his own reply appears in. Its second author is Paul Garner, the co-host of the podcast that is this article's primary text.
And on the arithmetic it does not fight. It contests no number in Helble's chain: not the 42,000 km³, not the 1,600 km front, not the twelve days, not the transport rate, not the resulting shortfall. It offers no counter-calculation of any kind. What it offers is this:
"Helble is correct that the processes he outlines could not have formed the Coconino during the Flood, but the Flood model requires extrapolations beyond conditions that prevail in the present-day. If a Flood model is correct, we will never be able to observe the depositional processes that made the Coconino in the laboratory or in nature."46
That is a fair statement of the position, and it should be taken at face value rather than mocked. But notice what it costs. The reply grants that no observable process can deposit the Coconino in the time available, and appeals instead to conditions that are unobservable in principle. An argument that rests on present erosion rates being a reliable guide to the past cannot also rest on the past being unobservable in principle. The reply is honest, and it concedes the double edge rather than escaping it.
The abstract's real dispute with Helble is a different one — whether the Coconino is wind-blown or underwater — and on that it lists eleven lines of evidence and argues none of them, promising fuller work "still being prepared for publication and peer review." As of this writing that work has not appeared.
What erosion actually removed
The objection Roth and Woodmorappe raise — that tectonic replenishment would have stripped tens of kilometres off the continents and left no Phanerozoic sedimentary rock — makes a testable prediction. It is worth taking seriously, because the prediction is right. Tens of kilometres have been stripped off, in specific places, and there is a way to measure how much.
Minerals record the pressure at which they formed. A metamorphic rock's mineral assemblage depends on the temperature and pressure of its last equilibration, and pressure at depth in the crust is simply the weight of the rock column above. Certain minerals are diagnostic: kyanite forms only in a restricted high-pressure field, and coesite — a dense form of silica — requires pressures found only at depths beyond about eighty kilometres. When a rock containing kyanite is sitting at the surface where you can hit it with a hammer, the column that was once above it is no longer there.
One caution, because it is a trap and a knowledgeable reader will spring it. Coesite-bearing rocks, like those in the Western Gneiss Region of Norway, prove burial past a hundred kilometres and return to the surface — but they were not unroofed by a hundred kilometres of erosion. Ultra-high-pressure terranes come back up buoyantly, flowing along the subduction channel, and most of their ascent is tectonic rather than erosional. They are evidence about how deep rock can travel, not about how much rain has fallen. The numbers this article uses are crustal-depth figures from ordinary orogenic belts, where the removal is much better attributed to unroofing and erosion.
That is not an inference from erosion rates. It is a measurement of depth, made on the rock itself, and it is entirely independent of how long the removal took. The conversion is straightforward: pressure at depth is the weight of the column above, so at a mean crustal density of 2,750 kg/m³ one kilobar corresponds to about 3.7 kilometres of rock.
The southern Appalachians are the test case, because they are the range Morton used against DeVilbiss. Rocks in the Blue Ridge record equilibration pressures from about 5.8 kbar at staurolite grade to 11.5 kbar in the Taconic core — that is, burial under roughly 21 to 43 kilometres of overburden, none of which is there now.47
Removal is not the same as erosion, and the difference matters here. A good part of that overburden was taken off tectonically: thrust sheets stacked during the Taconic, Neoacadian and Alleghanian events were later carried away by faulting, not by rainfall. So the honest statement is that 21 to 43 km of rock was removed from above these rocks by a combination of tectonic unroofing and erosion, and only the second part is denudation in the sense this article has been measuring. Spread across the ~450 million years since the Taconic that is 48 to 95 metres per million years, which is an ordinary orogenic figure — but it is an average across the orogenic interval, not a rate for the quiet time afterwards.
And that distinction is exactly where Morton's objection bites. His point was about the interval after the Appalachians stopped growing: "since that time there has been no significant orogenic activity… and the subsequent history of the mountain chain has been one of erosion." Averaging the orogenic and post-orogenic intervals together answers a different question from the one he asked. The post-orogenic numbers are much smaller — Cenozoic exhumation of the southern Appalachians has likely not exceeded about 1.2 km, and the removal was front-loaded — and no study closing the full 300-million-year budget was located for this article. What can be said is that the range is still standing after 300 million years because erosion slowed as relief fell, because isostasy kept lifting the root as the load came off, and because there is evidence of Miocene rejuvenation of relief. That is three mechanisms rather than a measurement, and Morton is entitled to say so.
This is why the two halves of the objection describe two different places. In orogenic belts the geologic column has been eradicated, exactly as Roth predicted it would have to be — you are standing on rocks that were once twenty or thirty kilometres beneath the surface, and the sediments that used to lie over them are somewhere else, as sediment. On cratons and stable interiors, where the flat-lying Phanerozoic cover survives, the measured erosion rate is not the global average at all.
The global compilation of beryllium-10 measurements makes the size of that difference plain. Across 1,599 recalculated rates, bare rock outcrops erode at a median of 5.4 m/Myr and a mean of 12 m/Myr, and not one outcrop in the entire global set exceeds 140 m/Myr.37 Drainage basins, which include soil-mantled slopes and steep terrain, come in ten times faster: median 54, mean 218 m/Myr. On the oldest and quietest surfaces the numbers get slower still. Australian granite on the craton has, in the authors' careful wording, "in some places eroded only decimeters over the past million years." The full measured range across their sixty-one samples is 0.3 to 5.7 m/Myr, and where this article names a single Australian figure it uses the bottom of that range, which the reader should discount accordingly.48 Namibian bedrock runs 3.2 to 3.6 m/Myr.49 The southeastern United States, a passive margin, ran about 8 m/Myr before European settlement.38
Put those two facts together and the objection dissolves. The arithmetic is worth seeing:
| Setting | Measured rate | Removed in 500 Myr |
|---|---|---|
| Arid Australian craton granite | 0.3-5.7 m/Myr | 150 m - 2.9 km |
| Namib bedrock | 3.2-3.6 m/Myr | 1.6-1.8 km |
| Global outcrop median | 5.4 m/Myr | 2.7 km |
| Global outcrop mean | 12 m/Myr | 6 km |
| Blue Ridge, kyanite grade | ~73 m/Myr (from barometry) | 36 km |
Those cratonic figures are the right order for what cratons have actually lost. The Colorado Plateau's entire Palaeozoic and Mesozoic sedimentary section is about three kilometres thick, sitting on a crust forty to forty-five kilometres deep, and the plateau has shed only four to eight hundred metres of it through the Cenozoic.50 Australia at the slow end of its measured range loses three hundred metres in a billion years, which is why surfaces and inselbergs there survive at all — though at the fast end of the same dataset a billion years removes 5.7 km, and the honest reading is that the craton spans both. And there is independent confirmation that the quiet places really were quiet: a GSA Bulletin study using thermochronology and stratigraphy, with no stake in this argument, concludes that the Colorado Plateau "remained near sea level for 500 m.y."51
The young-earth argument reaches its contradiction by applying mountain rates to cratons and craton preservation to mountains.
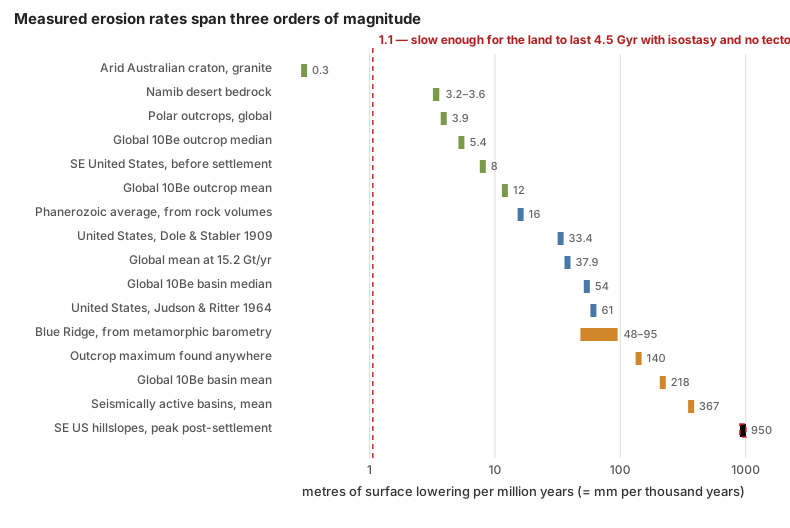
Laid out on a log scale, the spread is the whole answer. Measured rates run from 0.3 metres per million years on Australian craton granite to nearly a thousand on ploughed hillslopes — more than three orders of magnitude. There is no such thing as "the" erosion rate to divide the continents by. The red line marks the rate at which the present land surface would survive four and a half billion years on isostasy alone with no tectonics at all: about one metre per million years. Only the very slowest cratonic surfaces sit below it. That is precisely why active replenishment is not an optional extra in the account — it is required by the measurements.
Four things about that reply are weaker than they look, and a skeptic will find them. First, the basin median of 54 m/Myr does not reconcile as easily as the outcrop median; the answer — that basin rates are dominated by steep, tectonically active, soil-mantled terrain, and that the sampled basins cover only 2.3% of the land surface with known geographic bias — is a good argument but it is an argument, not a measurement. Second, cosmogenic rates integrate over thousands to a million years, and stretching them to hundreds of millions assumes a stationarity that cannot be directly tested. Third, cratons are not closed systems: they subside and receive sediment as well as shedding it, so "net exhumation over 500 Myr" is a balance, not a running total. Fourth, and most awkwardly, multiplying an average rate by a long time is precisely the move this article criticises the erosion argument for making.
That last point is why the barometry matters so much. It does not depend on any rate at all. A rock whose minerals cannot form under less than thirty kilometres of overburden, sitting in a roadcut, is evidence of removal regardless of how fast or slow or steady it was. Everything else in this section is supporting arithmetic; that is the measurement.
One further step is needed to answer Woodmorappe's version, and it is worth spelling out. His objection assumes that removing tens of kilometres would consume the crust — that a continent 37 kilometres thick cannot afford to lose thirty. It could not, if the crust were a fixed slab. But mountain building thickens crust before erosion thins it. Continental collision stacks and shortens the crust to fifty, sixty, in places seventy kilometres — the present crust beneath Tibet is roughly double the continental average — and erosion then unroofs that thickened pile while isostasy lifts its base. The sequence is not "start at 37 km and subtract 33." It is "thicken to 60, strip 30 off the top while the base rises, end near 37." The rock that was removed was not borrowed from a fixed budget. It was manufactured by the collision that raised the mountains, which is the same event the erosion is evidence of.
Fleming's hardest argument
There is a stronger version of this objection than Woodmorappe's, and Fleming makes it on the podcast. It deserves an answer rather than a mention.
He grants the reply, then tries to falsify it on a mass budget. If the American east coast has been retreating at a metre a year for two hundred million years, he says, and if uplift is what keeps it in place, then you would have to rebuild the crust about thirteen times over — once every fifteen million years — and therefore "you shouldn't have crust older than 15 million years on the East Coast."13 Then he brings a test: the measured age distribution of continental crust, which does not look like that at all. Most of it formed before the Phanerozoic. And he quotes a peer-reviewed conclusion at it: "regardless of sampling approach or geographic scale, igneous rock quantity does not decrease exponentially with increasing age as predicted by most basic models of rock cycling."
This is a real argument with an empirical test attached, and it is the best thing in either episode. It fails, but not for a trivial reason.
The premise is the coastal number, which the previous section has already dealt with. Set that aside; the argument still fails, and the reason is worth having.
Erosion does not destroy continental crust. It relocates it. When rock is stripped off the Appalachians it does not leave the continent. It travels a few hundred kilometres east and settles on the continental shelf and the coastal plain — and the shelf and coastal plain are continental crust, thinned and buried but not gone. Nothing needs to be "reformed," because nothing was consumed. Only the fraction that reaches the deep ocean and rides a plate into a trench is genuinely removed from the continental budget, and that fraction is small.
And the crustal age distribution does not measure what the argument needs it to measure. A crustal formation age records when rock crystallised from melt. Erosion does not reset it. Strip five kilometres off a Precambrian shield and the zircons in the rock you expose still give Precambrian ages, because they were Precambrian before you started. The age spectrum is a record of when crust was made, not of how much surface has since been carried away. The quoted sentence about igneous rock quantity is about whether the volume of preserved igneous rock decays with age, which is a real and interesting question and a different one.
The test Fleming proposes would work against a model in which erosion destroys crust and magmatism replaces it wholesale. Nobody holds that model. What holds the continents up is thickening at convergent margins, magmatic addition at arcs, and isostatic rebound as load comes off — none of which resets a zircon clock.
The global mean is the wrong statistic, and this is measurable. When Jane Willenbring and colleagues corrected their own earlier extrapolation — a public self-correction of a factor of five, which is worth noting in a debate about intellectual standards — they found that the steepest ten per cent of the continental surface supplies close to half of all global denudation.52 Wilkinson and McElroy, working from preserved rock volumes rather than from cosmogenic nuclides, put the share of the highest ten per cent at about 83% — the two estimates use different measures of terrain and different data, and the honest summary is that a small fraction of the land supplies somewhere between half and four-fifths of the sediment, with the exact fraction unsettled.
Either way the point stands. Averaging an actively rising orogen together with a Precambrian shield, and then treating the average as a depletion rate for the shield, is the actual error in the calculation.
And the clock has been checked against other clocks. Cosmogenic erosion rates have been tested against the volume of sediment physically piled up in alluvial fans over sixteen thousand years — agreeing within one standard error in the study that first did it,53 and within twenty per cent in a later one — and against apatite fission-track exhumation over roughly ten million years and 3.6 km of rock removal, agreeing within a factor of two.39 Three chronometers with no physics in common, spanning four orders of magnitude in time, give the same answer. That concordance is the thing a young-earth account has to explain, and this article is not aware of any attempt to.
The young-earth response to this dataset is worth reporting exactly. It is not silence. Michael Oard addresses cosmogenic methods in the Journal of Creation and rules them out before looking at them: "Some of them are indirect, such as chemical and cosmogenic isotopic methods, which rely on radiometric dating. Since these methods are based on uniformitarian assumptions, other more scientific methods will be used."54
That is a presuppositional refusal rather than a technical rebuttal, and it is a weaker position than silence would have been, because the concordance described above is not an assumption — it is three independent clocks agreeing, and one of them, the alluvial fan, can be measured with a shovel. Beyond that refusal no technical engagement with the beryllium-10 denudation data was found in the Journal of Creation, Answers Research Journal, or the Creation Research Society Quarterly. That search was not exhaustive and the CRSQ archive is poorly indexed, so the claim here is limited to what was looked for and not found.
Surfaces that should not have survived
Ariel Roth's strongest single move was not a rate calculation. It was to point at flat land surfaces that mainstream geologists themselves say are extremely old, and ask how they can still be there. His authority for this is C.R. Twidale, an Australian geomorphologist who wrote about the problem at length and in his own words called it an embarrassment:
"The survival of these paleoforms is in some degree an embarrassment to all of the commonly accepted models of landscape development."55
And:
"Even if it is accepted that estimates of the contemporary rate of degradation of land surfaces are several orders too high… there has surely been ample time for the very ancient features preserved in the present landscape to have been eradicated several times over. Yet the silcreted land surface of central Australia has survived perhaps 20 m.y. of weathering and erosion under varied climatic conditions, as has the laterite surface of the northern areas of the continent. The laterite surface of the Gulfs region of South Australia is even more remarkable, for it has persisted through some 200 m.y. of epigene attack."55
Both quotations are accurate, and Roth quotes them accurately. A two-hundred-million-year-old land surface, never buried, is a striking thing to have to account for.
Twidale accounts for it, in the same paper, in three ways that the creationist retelling leaves out.
First, he draws the distinction that does most of the work himself, on the second page: surfaces that were buried and later re-exposed are not evidence of anything. "They have been preserved as a result of burial and have only recently been reexposed to subaerial attack. Their survival thus poses few problems."55 A great many of the world's "ancient surfaces" — Precambrian ones in Canada, Greenland, India, and beneath the Great Artesian Basin — are of that kind.
Second, and more importantly, the genuinely old Australian surfaces are not preserved ground surfaces at all. They are etch surfaces, and Twidale says so explicitly:
"There is no evidence to suggest that these paleoplains and other paleoforms have been buried. But many are of etch type: the present surface represents either an exposed indurated horizon of the weathering profile, or the weathering front, that is, the base of significant weathering, or the junction between the regolith and the intrinsically fresh bedrock."55
That changes the object being dated. A laterite or silcrete surface is a hardened layer that formed inside a weathering profile, several metres below the ground of its day, under a porous sandy horizon that Twidale describes as "an absorbent cushion protecting the ferruginous horizon." Stripping that cushion away and exposing the duricrust is not the survival of an old landscape. It is the creation of the present one. The old thing is a chemical horizon, not a topography.
Third, Twidale lists five mechanisms he thinks preserve what does survive: aridity, repeated uplift, resistant structure and lithology, the concentration of river erosion into trunk streams while the ground between them barely lowers, and armouring of gullies by coarse debris shed from the caprock. None of these is a rescue invented later; they are in the paper Roth reviewed.
And the measurements since have gone a long way towards resolving it, though not all the way. The Australian surfaces erode at about 0.3 metres per million years, which removes three hundred metres in a billion years — quite slow enough for a landform to keep its shape. Crucially, they are eroding: not one of the sixty-one Australian samples was saturated in cosmogenic nuclides, which means every surface measured is losing mass.48 These landforms are old in form while being continuously lowered, which is a different claim from "nothing has happened here."
Fleming cites a real paper on exactly this, and it does not say what he takes it to say. In his chapter on continental erosion he notes that "I have seen rare mentions of the topic in scientific literature, but the authors assume that long ages are true, and therefore erosion rates have been extremely, impossibly low." His citation is Flowers, Bowring and Reiners, who used ancient helium dates on the western Canadian shield to report long-term unroofing of 2.5 micrometres a year or less since about 1.7 billion years ago.56 That is indeed an extremely low rate. But the authors do not present it as a rescue: their own sentence is that these rates, while far below what earlier thermochronology suggested for continental interiors, "are within the range of short-term erosional estimates." The rate is low because a Precambrian shield is the flattest, most tectonically dead terrain on the planet — which is the relief-dependence point again, arriving from a source Fleming chose himself.
The honest residual is real, and larger than the paragraph above implies. The cosmogenic rates measured on those very surfaces span 0.3 to 5.7 m/Myr, a factor of twenty, so arithmetic that makes a 200-million-year surface comfortable at the bottom of the range strips more than a kilometre off it at the top. Twidale did not accept the cosmogenic result quietly either; he published a formal Comment against it in Quaternary Research. Several Scandinavian and Greenland workers — Green, Lidmar-Bergström, Japsen, Bonow and Chalmers among them — push the other way, arguing that he over-dates and that no never-buried surface older than the Miocene is likely to survive. That is an active professional disagreement running in both directions, not a settled matter with a creationist holdout. And Twidale's word was "embarrassment," which he wrote himself, about his own field, and which no amount of context makes disappear.
Mountains, and the source that says the opposite
The third form of the argument is about uplift, and it has the cleanest resolution of the three, because the paper both sides cite settles it.
The claim, from Roth in 1986 and Fleming in 2024, is that measured uplift rates multiplied by deep time give impossible mountains. Roth quotes Schumm's figure of 7.6 metres of uplift per thousand years, notes it is about eight times the maximum rate of denudation, and reports the textbook consequence that for erosion to keep pace with a typical uplift rate a mountain would have to stand about forty-five kilometres high. Fleming works the same argument on Everest: erosion in the Everest region of about 2.1 mm/yr would level it in 4.2 million years, published uplift rates run from 4 mm/yr up to 65, and over the forty million years he takes for the range you would need "somewhere between 100 miles and 1,400 miles of uplift."4
Schumm's paper says the opposite of what it is cited for, in the same abstract. Immediately after the sentence about the eightfold disparity comes this one:
"Calculations of the time required for planation of 5,000 feet of relief suggest that ample time exists between orogenic periods for the development of peneplains."7
Quoting the first sentence without the second is quoting half of a pair. And Schumm goes further inside the paper, doing the isostatic correction himself, forty years before this article did it:
"If the denudation rate at 12,500 feet (1.6 feet per 1,000 years) is the average of these rates, 3 million years are required for the reduction of 5,000 feet of relief. If isostatic compensation requires a 5-fold adjustment, then peneplanation will occur in 15 million years."7
A factor of five, from the 1963 source, independently reproducing the factor of six derived above. Schumm's own curves also sit awkwardly with the forty-five-kilometre claim, though they do not refute it cleanly. What he writes is that maximum denudation rates "do not reach the average rate of uplift, 25 feet per 1,000 years, until relief is well above 20,000 feet" — a floor of about six kilometres, with no ceiling stated. He does not say where the crossover is. And the two figures are not the same quantity: Roth's forty-five kilometres comes from Blatt and colleagues comparing Ahnert's basin-average rates against a 10 m/kyr "typical" uplift, where Schumm is comparing maximum rates against 7.6 m/kyr. The honest statement is that the forty-five-kilometre number is not Schumm's and is not supported by him.
Finally, Schumm says where his 7.6 m/kyr uplift figure came from, and it is not a global rate. It is the average of five levelling stations around Los Angeles, sitting alongside measurements of glacial rebound in the Gulf of Bothnia and of the ground sagging under Lake Mead. His own caution: "The above rapid rates of uplift were measured in tectonically active areas or those adjusting to increase or decrease of load."
A measured uplift rate is mostly not permanent, and this has been quantified. Peter England and Peter Molnar made the distinction in Geology in 1990, aimed at professional geologists rather than creationists: "Many reports of surface uplift in mountain ranges are based on mistaking exhumation of rocks or uplift of rocks for surface uplift, and provide no information whatsoever on the rates of surface uplift."57 Ground measured moving upward between earthquakes is mostly elastic strain that the next earthquake gives back. For the Himalaya the permanent fraction has been measured: Stevens and Avouac found convergence of 13 to 21 mm/yr across the range, of which the anelastic — that is, permanently retained — part is at most about ten per cent.58 Multiplying the whole geodetic rate by tens of millions of years is multiplying by roughly ten times too much, and then compounding the error by assuming none of it erodes away.
And where anyone has actually closed the mass balance, it closes. In Taiwan, erosion runs at three to six millimetres a year on every timescale from decades to millions of years — the mountains are being built and removed at the same speed.59 For the Himalaya the sum has been done over twenty million years: about 7.1 million cubic kilometres eroded off the range against about 7.4 million deposited in the Bengal Fan and its neighbours — a four per cent difference, against stated uncertainties of twenty per cent on each figure.60 The rock that came off the mountains is not missing. It has been located, and there is the right amount of it.
Everest
Fleming's Everest numbers deserve individual treatment, because one of them is wrong and one of them identifies something real.
The 65 mm/yr uplift figure has no published basis — though it should be said at once that Fleming does not rest anything on it. On air he explicitly runs the argument on the slowest published rate instead: "back to the small measurement, if even the 4 millimeters per year, even at that rate, when you stretch it out over the 40 or 60 million years of Everest's supposed history, it does create a problem." Taking the weakest number that still makes your point is good practice, and the criticism below is aimed at the inference, not at the 65. No study reports vertical motion of Everest at anything like that rate; the number is the right size for horizontal India-Eurasia convergence, and appears to be a horizontal rate used as a vertical one. The measured GPS rock uplift is about 2 mm/yr, and the long-term rate from thermochronology is about 1 mm/yr.
But that gap is real, and mainstream geology finds it interesting rather than embarrassing. A 2024 paper in Nature Geoscience opens by naming it:
"Further evidence suggests a disconnect between the short-term rock uplift rate of Chomolungma measured from GPS data (~2 mm yr−1) and its long-term rock uplift rate recorded by thermochronology (~1 mm yr−1), which raises the question, is there an underlying mechanism raising Chomolungma's anomalous elevation ever higher?"61
Their answer is a specific, dated, local transient: about ninety thousand years ago the Arun river captured a neighbouring drainage, the accelerated incision that followed unloaded the crust, and the resulting isostatic rebound is lifting Everest an extra 0.16 to 0.53 mm/yr — accounting for perhaps fifteen to fifty metres of its 8,849. That is erosion raising a mountain, which is worth sitting with for a moment, since the young-earth argument treats erosion as purely subtractive.
So Fleming is right that the short-term uplift rate is about twice the long-term rate. Where the argument fails is in what follows: the gap is the subject of a recent paper in a leading journal, and its resolution is that the fast rate is a local transient rather than the steady state — which is exactly the kind of answer the argument needs to rule out and does not.
One claim could not be checked, and the review that reports it garbles the subject. On air Fleming says: "I ran into one article on Everest specifically, and on the erosion rate, the article said in the conclusion that the erosion rate of Everest must have been 50 times lower in the past than it is now. No mechanism — [it] just must have been that way."4 Woodmorappe's review renders this as a claim about "the volumes of sediment removed by rivers today," which is a different and much broader assertion. Fleming's version is narrower and about one mountain. Neither names the paper, and the book could not be obtained, so the source remains unidentified. A fiftyfold discrepancy asserted without a mechanism in a mainstream paper would be worth seeing; until someone produces the citation it cannot be assessed either way.
The ocean-sediment version, and one wrong denominator
The sister argument runs the same calculation in the depositional direction. If rivers deliver twenty-odd billion tonnes a year, the ocean floor should be buried in sediment. It is not. Nevins divided the mass of ocean sediment by the annual input and got thirty million years, against an ocean he took to be a billion years old. Andrew Snelling has made a version of this Answers in Genesis's single strongest young-earth evidence, listing it first in "The 10 Best Evidences from Science That Confirm a Young Earth."62 Fleming's version: there is "somewhere between one and two and a half times more sediment on the floor of the ocean than the continental mass above sea level," which at present rates is, in his words, fifteen to at most fifty million years' worth, against an ocean basin "supposed to be a couple hundred million years old."4
Everything in that paragraph is arithmetically fine. The denominators are not.
Fleming's is the closest to right of the three, and the distinction is worth being precise about: "a couple hundred million years" is roughly the age of the oldest surviving ocean floor, which is a real number. His error is using a maximum where an average belongs.
The ocean floor is not as old as the ocean. Oceanic crust is manufactured at spreading ridges and destroyed at trenches, so it has a residence time, and sediment older than the crust it sits on cannot exist. The area-weighted mean age of the world's ocean crust has been measured: 64.2 million years.63 Not one billion, and not three.
Redo the comparison with that number and the problem evaporates. Take Fleming's own bracket — ocean sediment at one to two and a half times the 3.19 × 10¹⁷ tonnes of continent standing above sea level — and divide by the measured pre-agricultural denudation flux of 15.2 Gt/yr. The answer is twenty-one to fifty-two million years' worth of continental erosion, sitting on a seafloor whose mean age is sixty-four million years. Those are the same number to within the precision either side can claim.
Three further complications all point the same way and none of them rescues the young-earth reading. A large majority of river sediment never reaches oceanic crust at all — it stops on continental shelves, in deltas, and in nearshore basins, which sit on continental crust. A large fraction of deep-ocean sediment was never continental in the first place: pelagic ooze is mostly biogenic calcite precipitated in surface waters. And sediment is continuously removed from the ocean, by subduction at trenches and by accretion into mountain belts. Jonathan Baker's point is the sharpest of these: the "average ocean sediment thickness" figure the argument uses is a deep-ocean pelagic number, so the calculation compares the wrong reservoir to the wrong source.64
The mass balance actually closes, and closes tightly. Take the mass of sediment on the ocean floor — 2.62 × 10¹⁷ tonnes — and divide it by the rate at which sediment is destroyed by subduction, about 1.5 km³ a year or 4.05 Gt/yr. The result is a residence time of 65 million years, against a measured mean seafloor age of 64.2 million. Those agree to within two per cent.65 Using Hay's own stated minimum removal rate of 1.0 Gt/yr instead stretches the residence time to 262 Myr, which brackets the 180-to-200-million-year age of the oldest surviving ocean floor. There is no combination of published numbers that gets near six thousand years: six thousand years at 20 Gt/yr delivers about one two-thousandth of the sediment that is actually there.
Nevins was not even wrong about the removal term. His figure of 2.75 Gt/yr destroyed by sea-floor spreading is close to the modern long-term estimate of about 2.7 Gt/yr. He had the right numerator and the right sink. He divided by the wrong clock.
So the correction is not the same size for everyone. Fleming is out by a factor of about three, from using the oldest seafloor age instead of the mean. Nevins is out by a factor of about fifteen, from using the age of the ocean. The version that compares sediment against a three-billion-year ocean is out by a factor of nearly fifty, and is comparing against an age no geologist assigns to the seafloor at all. In every case the numerator is fine and no care taken with it repairs the divisor.
And the sister argument: is there too little sediment altogether?
Roth's other mass-balance claim is broader. Citing Gregor, he argues that at present denudation rates roughly twenty-three times more sedimentary rock should exist than does.
His arithmetic is right, and this is the most interesting fact in the section. Recomputing the ratio from modern measurements of how much sediment survives from each era — about 20% of Phanerozoic, 2% of Proterozoic, and 0.5% of Archean — reproduces his figure to two significant digits: 23.0. Roth and the geologists are computing the same quantity. They disagree about one thing only: whether that factor of twenty-three is missing mass or recycled mass.
The evidence that it is recycled is direct rather than theoretical. About two-thirds of exposed bedrock on the continents is already sedimentary, so a river eroding a random square kilometre is, two times in three, eroding rock that has been through the cycle before. Detrital zircon grains carry U-Pb ages that identify their source, and the same age populations turn up in formation after formation — the grains are demonstrably second-hand. And Gregor, the source Roth cites for the twenty-three, concluded the opposite of the use made of him: his own estimate of the pre-human global denudation rate slightly exceeds the modern one, which is the same correction Judson made.
One honest concession, because it is the place the standard picture genuinely fails. The simple model in which preserved sediment decays away exponentially with age turns out to be false for continental shallow-marine sediment, which is about three-quarters of the surviving volume. The decay model holds for deep-sea and non-marine sediment and not for the largest category. That is a real defect in the textbook account, published by mainstream stratigraphers, and it should be reported by anyone using the recycling answer.
Where the argument is strongest
The rate calculation does not work. The second half of the case is much better, and it is not about rates at all.
It is this: contacts between rock layers that are supposed to be separated by millions of years are often knife-sharp and flat over enormous areas, with no channels cut into them, no soil developed on them, and no weathering. If erosion happens on the timescale of a human life — and it plainly does — then a surface left exposed for six million years should look like something. Often it does not.
Fleming's examples, from the second episode: the Hermit Formation and the Coconino Sandstone in the Grand Canyon, separated on the standard timescale by about six million years and meeting at a flat contact; the Moenkopi and Shinarump, separated by fifteen to forty million; another case at fifty million; and the Great Unconformity itself, where roughly 1.2 billion years is missing.4 He adds two details that make it worse. Cobbles at the base of the Shinarump have pressed down into the underlying Moenkopi as load casts, which requires the Moenkopi to have still been soft mud when they landed on it. And John Whitmore's work at the Hermit-Coconino contact identifies clastic injectites — sand forced down into cracks — which likewise requires unlithified material.
The tradition behind this is older and better documented than the rate argument. Ariel Roth compiled the cases in 1988,9 and before him George McCready Price and Whitcomb and Morris made the same point. Woodmorappe's version is the sharpest: a Devonian limestone grading imperceptibly into an Ordovician limestone beneath it, with the entire Silurian missing and no physical trace of its passing.
This deserves a straight answer, and this article does not have a complete one. What it has is five partial ones, and their honest status is worth stating.
First, a flat contact is not the same as a surface that sat exposed. The claim in the literature is not that a landscape lay unchanged for six million years. It is that no rock of that age is preserved at that spot — material may have been deposited and removed, or bypassed the site entirely. The distinction matters and is often lost in the retelling.
Second, Fleming supplies the counter-example himself, names the inference, and answers it — and his answer is where the disagreement actually lies. Discussing the six-million-year Hermit-Coconino gap, he shows a diagram from his own book explaining how such gaps are constructed, and points out that a thick unit called the Schnebly Hill Formation appears between the same two formations a short drive south, near Sedona:
"The Coconino and the Hermit, for example — if you drive south from Grand Canyon, so you go to kind of the area of Sedona, there's a thick formation between the Hermit Formation and the Coconino called the Schnebly Hill, which must have been deposited in that gap."4
His own conclusion from this is that the Schnebly Hill did not take six million years to deposit either, so the gap can be collapsed along with the rest of the column. He is right about the stratigraphy. The stratigraphy does not support the conclusion he draws from it. The Schnebly Hill is about three hundred metres thick 125 km south of the canyon and over six hundred metres in the Holbrook Basin, thinning northward to a zero edge. Its top contact with the Coconino is gradational and intertonguing, with no major unconformity.66 That means the base of the Coconino is diachronous: the Coconino at Grand Canyon is the younger part of a sand sea whose older equivalents lie to the south. The contact in the canyon is a facies boundary that climbs through time, not a single surface that lay exposed for six million years.
Whitmore, whose Coconino work Fleming cites, concedes the pivot in a single clause: the missing time exists only "assuming the top of the Hermit is isochronous."67 Blakey's intertonguing relationship is direct field evidence that it is not.
The six-million-year figure itself is soft. No primary source for it could be located; Whitmore writes "5–10 Ma?" with a question mark, and the National Park Service describes Permian deposition in the canyon as "nearly continuous."68 A number quoted to one significant figure and used to carry an argument should have a citation, and this one does not.
Where the reply does not reach: Grand Canyon lacks the Schnebly Hill entirely, so something there was neither receiving those sediments nor being deeply eroded while hundreds of metres piled up two hundred kilometres away. A depositional pinch-out on a very low-gradient surface near base level is a coherent account of that, but it is an inference from the geometry rather than an observation of non-erosion.
Third, where a surface really was exposed for a long time, the evidence is often there — and it is in the Grand Canyon. The Redwall Limestone carries palaeokarst: sinkholes and collapse breccia, formed by rock dissolving subaerially. The Surprise Canyon Formation fills stream channels cut as much as four hundred feet down into the Redwall. The Precambrian surface beneath the Grand Canyon Supergroup has up to 240 metres of erosional relief on it, and the Esplanade Sandstone up to 16 metres.69 So the prediction — expose a surface long enough and you will find channels, karst, and soils — is met in the same canyon, at other contacts. What has to be explained is why some contacts show it and others do not, and that is a narrower and more tractable question than the one the argument poses.
Fourth, the injectite argument is real research, and it says less than Fleming says it says. The work he cites is Whitmore and Strom's study of sand-filled cracks at the base of the Coconino, and it deserves respect on two counts: it is original fieldwork at thirty locations under a Park Service research permit, and it was published in Sedimentary Geology, a mainstream Elsevier journal, not in a house organ.70 Its case that these are injectites rather than desiccation cracks is strong — flow banding at hand-lens and thin-section scale, sandstone-clast breccias, cracks up to fifteen metres deep, a depth distribution zoned around the Bright Angel fault, and a preferred crack orientation roughly perpendicular to the fault zones.
But the authors state the difficulty against themselves, in their own words:
"A problem with no readily apparent solution is that it appears the basal Coconino was water saturated and unlithified (or only partially lithified) at the time of Laramide faulting which we suspect caused dike intrusion. It is unlikely the Coconino could have remained uncemented in excess of 250 million years."70
And they then offer two conventional escapes themselves, one of which — earlier movement on the Bright Angel Fault, shortly after the basal Coconino was deposited — is entirely compatible with deep time. Fleming does not conceal any of this — he lays out the conventional chronology accurately on air, including that the injection most likely happened around the Laramide, tens of millions of years after both formations were deposited. The disagreement is over the inference, not the reporting. What can fairly be said is that presenting it as a settled time conundrum states the case more strongly than its own authors do. Sand injection tens of millions of years after burial is documented worldwide and requires fluid overpressure rather than youthful sediment; what Whitmore and Strom have identified is a real question about cementation timing, not a demonstration.
Fifth, and most important: mainstream stratigraphy agrees that the time is in the contacts, and says so in numbers. This is the part of the answer most creationist treatments never encounter, and it is not a hand-wave.
Peter Sadler compiled nearly 25,000 measured rates of sediment accumulation in 1981 and found they span at least eleven orders of magnitude, with the average rate falling systematically as the measurement interval lengthens.71 The reason is that sediment does not accumulate steadily; it accumulates in bursts separated by long periods of nothing. Working the carbonate-platform data through, Sadler's own conclusion is that the bedding-plane surfaces stratigraphers use to bound metre-scale cycles record eighty to ninety per cent of the time in each cycle.72 The time is not in the rock. It is in the surfaces between the rock.
A 2018 review in the Annual Review of Earth and Planetary Sciences pushes this much further, with a worked example. Take a twenty-metre body of cross-bedded fluvial sandstone that represents twenty thousand years on the long-term accumulation rate. Count the cross-sets: about a hundred, each recording the passage of a single dune face, which at measured sand fluxes takes under four hours. A hundred sets is therefore under four hundred hours of actual deposition inside twenty thousand years — a temporal completeness of two parts in a million. The authors' own summary: "the fraction of time actually represented in the strata is so vanishingly small that recorded time is best thought of as a kind of dust."73
So the mainstream position is not that the six million years left a record which creationists have overlooked. It is that almost all geological time is missing from the rock, everywhere, at every scale, and that this has been quantified for forty-five years. The missing time, the same review argues, is mostly stasis — surfaces where nothing was happening, neither depositing nor eroding — which is physically the exact condition a flat, unweathered contact records.
This concession is enormous, and a young-earth reader should sit with it before deciding who it helps. It grants that the rock record is mostly absence of record. What it does not grant is that the absence can be squeezed to zero. The same review considers the strong-catastrophist reading — that if completeness is that low, the preserved beds should be the deposits of enormously rare mega-events — and rejects it on the grounds that measured palaeotransport conditions say otherwise: the record is, in their phrase, "strangely ordinary."73 The beds look like ordinary rivers and ordinary dunes doing ordinary things, not like a global cataclysm.
And there are two real limits to how far this cuts, both from inside the same literature. John Tipper notes that the proportion of stasis in a system cannot be reliably recovered from the strata it leaves behind — an honest admission of a parameter that is not measurable in practice, and one that weakens the mainstream account exactly as much as the young-earth one.74 And stasis may not even be needed: Schumer and colleagues showed that a surface performing a random walk reproduces the Sadler scaling on its own, with no quiet intervals required at all. That is the most deflationary result in the field, and it cuts against the stasis answer this section just gave.
What is left over is real. Sharp, laterally extensive contacts across long claimed hiatuses are a genuine feature of the record; the explanations are partly inferential; and a reader who finds them unsatisfying is not being unreasonable. This is the part of the young-earth geological case that is worth working on. It is also, notably, not an argument about erosion rates — it is an argument about the absence of erosion, which is why the double edge described earlier bites so hard. Every flat contact that counts as evidence against deep time is also a place where the flood was supposedly moving continent-scale volumes of sediment without leaving a scratch.
Verdict
The arithmetic is right and the conclusion is wrong.
The measured numbers are not in dispute. Rivers really do deliver enough sediment to level the continents in twelve to twenty-five million years, mainstream textbooks really do say so, and the creationist writers who first published the calculation — Nevins in 1973, Roth in 1986 — did the sums correctly on good data. That should be conceded without hedging, because it is true and because pretending otherwise makes the rest of the reply look evasive.
The inference fails at three points, in increasing order of importance. Isostasy multiplies the required erosion by about six, which buys a factor of six and no more. Relief-dependence makes the decline exponential, which does not help at all over billions of years. And the continents are actively rebuilt, which is the answer — an answer independently confirmed by walking up to rocks that formed twenty kilometres underground and are now at the surface, and by three unrelated chronometers agreeing on the rates.
Two things ought to be said beyond that.
The popular coastal version should be dropped. It confuses horizontal retreat with vertical lowering, uses the retreat rate of twenty-thousand-year-old glacial sand as a rate for continental rock, reads the continental shelf backwards, and ignores the fact that modern shorelines are only a few thousand years old — a fact its own author states correctly, on the record, before setting it aside. A geologist reading it will stop reading.
But one narrow version of it is still open, and pretending otherwise would be the same failure in the other direction. Even after granting the measured tenfold correction from historic to millennial rates, the best long-term rocky-coast numbers still imply hundreds of kilometres of retreat in ten million years. Closing that gap requires the true deep-time rate to be another fifty to a hundred times slower again. Rates that slow have now been measured — but at eleven sites on two quiet coastlines, which is a thin basis for a global claim. The mainstream account of rocky coasts over a hundred million years currently rests on a correction that is real, is physically expected, and is not yet established at global scale. That is a legitimate thing for a skeptic of deep time to press on, and it is the only part of the coastal argument that is.
And the argument's own literature has twice contained its refutation. DeVilbiss said it at the first International Conference on Creationism in 1986. Woodmorappe said it in the Journal of Creation in December 2024. Neither was followed up, and the argument has never been placed on any creationist organisation's list of claims to retire — although the precedent for exactly that exists, in the same organisations, in the moon-dust retraction of 1993.
The most useful thing a young-earth reader can take from this subject is not a proof. It is a standard. Snelling and Rush spent seven years and forty pages killing an argument they wanted to be true, and wrote that the conclusions were "not as encouraging or complimentary for us young earth creationists as we would have liked." Answers in Genesis states the same principle in its own words, on its own site, on the page explaining why some creationist arguments have to be dropped:
"We would do a disservice to our witness for Christ by knowingly using bad argumentation—effectively bearing false witness—even if those arguments are used to support the truth of the Bible… We must subject creationist claims to the same high standards of peer review we would demand of evolutionists."75
Applied here, that standard retires the erosion clock. It leaves the flat-contact problem standing, which is the part actually worth the work.
Companion article
Natural Arches, Rock Bridges, and the Age of the Earth — the same argument run on a landform that really is young. Rock arches collapse on human timescales and everyone agrees they are recent; whether that says anything about the age of the earth is a separate question, and the arithmetic has been done badly on both sides there too.
Companion pages
- The literature — every source consulted, catalogued with what it measured, over what timescale, and which way it cuts.
- Natural Arches, Rock Bridges, and the Age of the Earth — the same style of argument at the scale of a single landform.
Sources
- 1.
Nevins, Stewart E. “Evolution: The Ocean Says No!” Impact 8. Institute for Creation Research. Nov 1, 1973. A short creationist article in the Institute for Creation Research's Impact series, by an assistant professor of geology at Christian Heritage College; the old footnote identifies the author with Steven A. Austin, and it was reprinted in Morris, Gish & Hillestad (eds.), Creation: Acts, Facts, Impacts (1974), pp. 164-172. It adds up the yearly sediment that rivers, glaciers, groundwater, waves and wind carry into the ocean, 27.5 billion tons less salt spray, and divides the mass of the continents above sea level by that figure to get 14 million years to wear them away. The article uses it because Nevins turned that erosion rate into a young-earth argument. ↩
- 1a.
Section RATES OF EROSION: “The continents are being denuded at a rate that could level them in a mere 14 million years! Yet, evolutionary-uniformitarian geologists feel certain that the continents have existed for at least 1 billion years. During this supposed interval of time the present continents could have been eroded over 70 times! Yet—miracle of miracles—the continents are still here and do not appear to have been eroded even one time!” ↩
- 1a.
- 2.
Southard, John. “How Fast Are the Continents Worn Down?” The Environment of the Earth's Surface. Geosciences LibreTexts. n.d. Section 11.4. A section of a geology textbook on Geosciences LibreTexts, derived from MIT OpenCourseWare course material, on how fast continents are worn down. The article quotes it for the statement that a continent like North America would be worn down to low-lying terrain in about ten million years, a figure from an undergraduate geology textbook. ↩
- 3.
Woodmorappe, John. “A strange admixture of erosion geology and tendentious theology.” Journal of Creation 38(3):33–35. Dec 2024. A review in a creationist journal of Fleming's book Stories About Earth's History. Woodmorappe is a pen name, and the review was posted online on 20 April 2026. The article quotes its doubt that erosion rates are independent of topography, and its objection that the continents would have to lose all their Phanerozoic (the last roughly 540 million years) rock. ↩ ↩
- 3a.
“The problem with the continent-rising idea is that, were it a viable solution to the erosion problem, tens or perhaps hundreds of kilometre thickness of rock would have to be removed everywhere from every continent. There would be no Phanerozoic sedimentary rock left anywhere on Earth. Yet there are, and so the rising-continent idea does not even begin to solve the continental erosion problem for uniformitarians.” ↩
- 3a.
- 4.
Wood, Todd et al. “Episode 88: Erosion STILL shows the earth is young! Part 2.” Let's Talk Creation. Jul 1, 2024. A 50-minute episode of Let's Talk Creation, with Todd Wood and Paul Garner, in which Monte Fleming takes part. The article uses it to set out what Fleming himself concludes, which is more modest than the version usually attacked. ↩
- 4a.
At 12:12: “There's isostatic rebound, so it's like if you have an ice cube floating in the top of a cup of water and knock the top off, it's going to pop up a little higher. And you keep knocking the top off and it'll keep popping up — you know, you take 10% off every time and it'll keep rising.” ↩
- 4b.
At 13:03–13:34: He is discussing the volume of sediment trapped behind the world's dams, one of the arguments in his own book. ↩
- 4c.
At 46:57–47:50. ↩
- 4d.
At 30:35: In full: “So the estimates that I've seen is that maybe it's twice as high, so it's not the orders of magnitude that you need.” ↩
- 4e.
At 26:53–27:23. ↩
- 4f.
At 33:49: The passage runs on from this point. ↩
- 4g.
At 21:05: Also at 22:07. ↩
- 4h.
At 35:29. ↩
- 4i.
At 23:29–28:18. ↩
- 4a.
- 5.
NOAA National Centers for Environmental Information. ETOPO 2022 Global Relief Model. 2022. A global model of land and sea-floor height, released as 60 arc-second ice-surface and bedrock grids. From it the article computes a land area of 148.48 million km², a mean land elevation of 794.5 m at the ice surface (649.1 m for bedrock beneath the ice, and 654.9 m excluding Antarctica and Greenland), 117.97 million km³ of rock above sea level, a mass of 3.19 × 10¹⁷ t at 2.7 t/m³, and 26.26 million km² of continental shelf between 0 and −200 m. The article uses the mass figure for the rock standing above the waterline. ↩ ↩
- 6.
Roth, Ariel A. “Some Questions about Geochronology.” Origins 13(2):64–85. Geoscience Research Institute. 1986. A journal article raising questions about geochronology, the science of dating rocks and the age of the Earth, in the journal of the Geoscience Research Institute. The article calls Roth the most rigorous writer in its young-earth tradition on erosion, and relies on him because he works through six independent rate arguments and answers the standard counter-explanations one at a time. ↩
- 6a.
“Gilluly (1955) estimates that 13.6 km3 of solid material are carried to the world oceans every year.” ↩
- 6b.
“The estimate of 10 Ma given above has been a well-accepted figure (Schumm 1963) and has subsequently been referred to in a number of publications including Dott and Batten (1971, p. 136) and Garrels and Mackenzie (1971, pp. 114-115).” ↩
- 6c.
“The lowest rates found in a study of 20 river basins (Ahnert 1970) was 1.6 cm/1000 years for basins in Texas and England.” Roth adds: “Rates of 92 cm/1000 years are reported for the Guatemala-Mexico Border Mountains (Corbel 1959), 100 cm/1000 years for the Himalayas (Menard 1961)… Probably the highest recorded regional rate is 1900 cm/1000 years from a volcano in New Guinea (Ollier and Brown 1971).” ↩
- 6d.
Roth's statement of the objection to tectonic replenishment, quoted in full in the text above. ↩
- 6e.
“Judson (1968), while correcting for human activity, suggests 34 Ma for complete erosion of the continents.” Roth reports this correction fairly, in the same paragraph as the 10.2 Myr figure, and then argues that even 34 Myr does not close the gap. That is a legitimate move. What is not legitimate is later writers dropping the correction entirely. ↩
- 6a.
- 7.
Schumm, Stanley A. “The disparity between present rates of denudation and orogeny.” U.S. Geological Survey Professional Paper 454-H. 1963. A US Geological Survey paper that compares how fast land is worn down (denudation) with how fast mountains are built up (orogeny). Its abstract says modern orogeny is about eight times greater than the average maximum denudation rate, a figure creationist writers cite. The article uses it because the paper itself discusses isostatic compensation, the way the crust rises as erosion removes weight. ↩ ↩
- 7a.
Section abstract, page H1: The preceding sentence in the same abstract is the one creationist authors quote: “Modern rates of orogeny are about 25 feet per 1,000 years, or about eight times greater than the average maximum denudation rate.” ↩
- 7b.
Page H10: His figure 2 also shows that maximum denudation rates. “do not reach the average rate of uplift, 25 feet per 1,000 years, until relief is well above 20,000 feet.” The 25 ft/1,000 yr uplift figure is the average of five southern Californian localities taken from Gilluly (1949). Schumm's other high uplift rates are Fennoscandian and Laurentide glacial rebound and the subsidence of the ground beneath Lake Mead. ↩ ↩
- 7a.
- 8.
Judson, Sheldon, and Dale F. Ritter. “Rates of regional denudation in the United States.” Journal of Geophysical Research 69(16):3395–3401. 1964. A 1964 paper on how fast erosion lowers the land in regions of the United States. The article uses it for the average lowering of 6.1 cm per thousand years, the figure creationist writers reuse. ↩
- 9.
Roth, Ariel A. “Those Gaps in the Sedimentary Layers.” Origins (Geoscience Research Institute) 15(2):75–85. 1988. A General Science Notes article by Ariel A. Roth of the Geoscience Research Institute, asking whether the gaps between rock layers show the long-term erosion that the standard geologic time scale predicts. Its main example is Palo Duro Canyon in Texas, where the Ogallala Formation, which the standard time scale dates to about 2 to 5 million years, lies flat on the Triassic Trujillo Formation across a gap the time scale assigns about 200 million years; the flat contact runs over about 150,000 km2. The article uses it as the fullest statement of the gaps argument, the one later creationist writing depends on. ↩ ↩
- 10.
Walker, Tas. “Eroding ages.” Creation 22(2). Mar 2000. A magazine article by Tas Walker in Creation. The article uses it because it reproduces Roth's figures and examples almost line for line, and it shows how that argument reached popular creationist writing in the 1990s and 2000s. ↩
- 11.
Fleming, Monte, and Leonard Brand. “The role of wind in sediment removal from potholes in semiarid environments.” Geomorphology 329:194–205. 2019. A 2019 study in Geomorphology of fifty potholes in the Navajo Sandstone on Rock Window Mesa, Arizona, using a high-resolution digital elevation model (a detailed 3D map of the ground) and wind measurements inside eleven of them. Two more papers by Fleming are: "A 3-D-printed precision sediment feed." in Journal of Sedimentary Research 93(8):541–551 (2023), doi:10.2110/jsr.2021.069; and "Pothole formation on Rock Window Mesa, Chinle valley, AZ." by Monte Fleming, Cornelis Bootsman, Norman Moll and Leonard Brand in Geomorphology 468:109498 (2025), doi:10.1016/j.geomorph.2024.109498. The article cites them to show that Fleming has done original research in mainstream journals. ↩
- 12.
Fleming, Monte. Stories About Earth's History: A Geologist's Dissent From Deep Time. Independently published. Dec 12, 2021. The publisher's description reads: “This book contains nine independent arguments from different areas of geology, each of which constrains the age of the earth to a tiny fraction of 4.543 billion years. The data on which these arguments are based is readily available and the math is simple, so you can study each of the topics for yourself.” Chapter 1 uses the isostatic. “block of ice floating in a tub of water”. analogy. A self-published book that argues against the standard age of the Earth. It has 121 pages in paperback (Goodreads lists the Kindle edition at 125) and carries ISBN-13 979-8770378399. The book divides erosion into two chapters, Chapter 1 on coastal erosion and Chapter 2 on continental denudation, and Chapter 1 carries the 78 cm and 20 cm coastal figures. The article uses it as the book behind Fleming's erosion figures. ↩
- 13.
Wood, Todd et al. “Episode 87: Erosion Shows the Earth is Young! featuring Monte Fleming.” Let's Talk Creation. Jun 17, 2024. A 49-minute episode of the Let's Talk Creation series, with Monte Fleming as the guest, on how fast coastlines and continents wear away. The article takes its coastal erosion figures from the episode and quotes Fleming's arguments about uplift, sea level and rock type. ↩
- 13a.
At 22:04: “If you look in the deeper waters, on average it's about four kilometres deep. And then the continental material comes up and that's about 800 metres tall on average.” ↩
- 13b.
At 44:46–45:14: His full statement: “Let's say the East Coast erodes 10,000 meters and then it's uplifted 20 meters over and over again relative to sea level. How much uplift do you need in 200 million years?… that's 400,000 meters, over 400 kilometers… only 30 kilometers thick in the east. And so to erode 40 kilometers of crust, you have to reform the crust 13 times in 200 million years. That's once every 15 million years… You shouldn't have crust older than 15 million years on the East Coast.” ↩
- 13c.
At 15:53: “If you Google the rate of coastal erosion in the East Coast, it actually matches pretty well with the lighthouse moving data. I think if you Google it, it comes out about a meter a year. And if you look at the lighthouses at each of the places where these lighthouses were moved, it's about two feet per year.” At 16:38: And on the west coast: “if you Google it, it's about a few centimeters per year.” ↩
- 13d.
At 19:24. ↩
- 13e.
At 17:03: “I think the rock type that the waves encounter matters a lot. And, you know, here in Southern California… it's pretty consolidated lithified Miocene material, for example. There are a lot more rocky cliffs.” ↩
- 13f.
At 35:46. ↩
- 13g.
At 35:46–36:07. ↩
- 13h.
At 35:15: Fleming is describing his own re-measurement of the terrace-correlation figure in Merritts, D. and Bull, W.B., "Interpreting Quaternary uplift rates at the Mendocino triple junction, northern California, from uplifted marine terraces," Geology 17(11):1020-1024 (1989), which the episode's show notes cite. ↩
- 13i.
At 35:46. ↩
- 13a.
- 14.
Ramgren, Jake. “Leaping Lighthouses!” New Creation blog. Apr 29, 2026. A popular blog post on the New Creation blog, which the article takes as the popular form of the erosion argument and checks for arithmetic. ↩
- 14a.
“Geologist Monte Fleming evaluated the data for the continental uplift theory and found that the crust would have to be raised 50 kilometers in order to combat the erosion… The east coast would require 400 kilometers to keep the coast where it is today… it would be the same height above sea level as the International Space Station!” Ramgren also discloses, to his credit, "I am no geologist." ↩
- 14a.
- 15.
Duff, R. Joel. “Leaping to Conclusions: What Coastal Erosion Actually Tells Us About Deep Time.” Naturalis Historia. Jun 8, 2026. A reply, in the online publication Naturalis Historia, to Jake Ramgren's popular argument from coastal erosion. The article relies on it for the point that coastal retreat is a sideways measure, while the erosion that levels a continent is a vertical one, and for its verdict on the 400-kilometre figure. ↩
- 15a.
Duff's point that coastal retreat is a sideways measure, while denudation is the loss of elevation across the whole surface. ↩
- 15b.
The article cites this footnote for a point from Duff; the old footnote gives no place or quotation. ↩
- 15c.
The article cites this footnote for a point from Duff; the old footnote gives no place or quotation. ↩
- 15d.
The article cites this footnote for a point from Duff; the old footnote gives no place or quotation. ↩
- 15a.
- 16.
Wittmann, Hella et al. “A global rate of denudation from cosmogenic nuclides in the Earth's largest rivers.” Earth-Science Reviews 204:103147. 2020. “we obtain a global source area denudation rate of 141 t/km2×yr (54 mm/kyr of rock-equivalent)… we upscale this value to the total surface area for exorheic basins, thereby obtaining a global denudation flux of 15.2 ± 2.8 Gt/yr that integrates over the past 11 kyr. This value is slightly lower than published values from cosmogenic nuclides from small river basins (23 (+53/−16)) Gt/yr) upscaled using a global slope model, and also lower than modern sediment and dissolved loads exported to the oceans (24.0 Gt/yr).” After the 3.07 Gt/yr measurement the paper continues: “By assuming that this sub-dataset is representative of the global land surface,”. The paper then upscales the figure. A research paper that estimates how fast the land is worn down across the world's largest river basins, using cosmogenic nuclides, which are rare atoms made in rock by cosmic rays. The authors scale the rate up to a global flux of 15.2 ± 2.8 Gt/yr (billion tonnes a year), which they set against 24.0 Gt/yr of sediment and dissolved load already reaching the ocean. The article uses it as its most useful single number for how much rock rivers deliver to the sea. ↩ ↩
- 17.
Gregor, B. “Denudation of the Continents.” Nature 228:273–275. 1970. A piece in the journal Nature that reports a 1968 global erosion estimate by Sheldon Judson, published in American Scientist 56:356–374 (1968) as "Erosion of the land, or what's happening to our continents?" The article uses it for the figure that human activity has raised global erosion from 9 to 24 billion tons a year. ↩
- 18.
Dole, R. B., and H. Stabler. “Denudation.” Papers on the Conservation of Water Resources, USGS Water-Supply Paper 234, 78–93. 1909. “one inch in 760 years”. Their own stated result, which is 33.4 m/Myr. Converting and dividing their tonnage gives 33.6 m/Myr. The authors caution that their suspended estimates. “may be in error as much as 50 per cent”. A US Geological Survey estimate of the material that US rivers carry off the land each year, counted as dissolved load and suspended load, with no bed load. Their US total is 270 million short tons of dissolved and 513 million of suspended load per year, over 3,088,500 square miles. The article uses it as an older and cleaner measurement of the same rate, to set against the Judson and Ritter figure. ↩
- 19.
Wilkinson, Bruce H., and Brandon J. McElroy. “The impact of humans on continental erosion and sedimentation.” GSA Bulletin 119(1-2):140–156. 2007. A 2007 GSA Bulletin paper by Bruce Wilkinson and Brandon McElroy on how humans have changed erosion on the continents, with a headline denudation figure of 16 m/Myr; the Phanerozoic mean of 16 m/Myr is derived from Ronov's compilation of preserved sedimentary rock volumes corrected for erosional and subductional destruction, which makes it a measurement of the rock record rather than an extrapolation of present rates. They put cropland at about 11% of global land and cropland and pasture together at about 37% of the ice-free continents, and convert 16 m/Myr to about 5 Gt/yr at an assumed rock density of 2.5 t/m³, whereas this article uses 2.7 throughout, which is why its table gives 6.4 Gt/yr; the paper also has one internal inconsistency worth knowing, its Pliocene figure of 16 Gt/yr in the abstract against 19 Gt/yr in the text. The article uses it for the rock-record average, about a third of the present rate over the last half-billion years, and for the point that about 83% of river sediment flux comes from the highest ten per cent of the earth's surface, while about 83% of cropland erosion happens on the lowest sixty-five per cent. Mirror: Rpgroup.caltech.edu ↩ ↩
- 20.
Morton, Glenn R. “Geologic Challenges to a Young Earth.” Proceedings of the First International Conference on Creationism 1:137–146. 1986. A paper by Glenn R. Morton, printed as article 50 of volume 1 of the proceedings of a creationist conference. Its abstract says that geology presents severe challenges to the young-earth view held by most creationists, and that very few members of the geoscience professions are counted among the creationist ranks. The article uses it for Morton's erosion argument, including his calculation for the buried Appalachian folds.
- 20a.
Pages 144–145: The printed discussion of Morton's paper, by John W. DeVilbiss. Pittsburgh, 1986. ↩
- 20b.
Page 145: DeVilbiss's preceding sentence: “When the author mentions another approach to the calculations where the rate of erosion is taken to be related to the average altitude of the mountain chain, I believe he falls into error.20: page: 139”. Morton says that young-earth creationists, like the old earthers, have generally ignored the problem presented by these same erosion rates when regional unconformities are discussed. ↩
- 20c.
Page 139: Morton says that young-earth creationists, like the old earthers, have generally ignored the problem presented by these same erosion rates when regional unconformities are discussed. ↩ ↩
- 20d.
Morton's figures: buried southern Appalachian folds 10,000-20,000 ft high with up to 10,000 ft eroded from the fold tops, then covered by 2,500 ft of unfolded Cretaceous strata, from Texaco seismic data as published in Bally (1983); Transverse Ranges erosion of 7.5 ft per thousand years from U.S. Geological Survey Research (1972), p. A132. “Using the fastest rate of erosion listed above, it would take 1,300,000 years to erode ten thousand feet off of the buried Appalachians.” ↩
- 20a.
- 21.
Morton, Glenn R. “CLOSURE.” Proceedings of the First International Conference on Creationism 1:145–146. 1986. Morton's reply to the printed discussion of his paper, in the same proceedings. Morton left young-earth creationism some years later and spent the rest of his life writing against it. The article uses it for Morton's conclusion that, because the Appalachians have only been eroding for the time DeVilbiss proposes, the Appalachians could not be 200 million years old. ↩
- 22.
Snelling, Andrew A., and David E. Rush. “Moon Dust and the Age of the Solar System.” Creation Ex-Nihilo Technical Journal 7(1):2–42. 1993. Page 34. A 1993 paper by two authors in a creationist technical journal, on the moon dust argument for a young solar system. Andrew Snelling is now Director of Research at Answers in Genesis. The article uses it for the paper's conclusion that creationists should stop using moon dust as evidence for a young moon, earth and solar system. ↩
- 22a.
Section Acknowledgments, page 35. ↩
- 22a.
- 23.
Prémaillon, Mélody et al. “GlobR2C2 (Global Recession Rates of Coastal Cliffs): a global relational database to investigate coastal rocky cliff erosion rate variations.” Earth Surface Dynamics 6:651–668. 2018. “Median erosion rates are 2.9 cm yr−1 for hard rocks, 10 cm yr−1 for medium rocks and 23 cm yr−1 for weak rocks.” On the deleted null values: “These null values represent 67 % of the studies of rocky coasts, which means that slowly eroding rocky coasts are common and ignoring this information can affect conclusions.” A global database of erosion rates on rocky coasts, drawn from 58 studies, 42 of them European. It contains no African data at all. The article uses its medians as the measured rates for real rock, with chalk counted as weak rock. ↩
- 24.
Hapke, Cheryl J., and David Reid. “National Assessment of Shoreline Change Part 4: Historical Coastal Cliff Retreat along the California Coast.” USGS Open-File Report 2007-1133. 2007. “The average rate of coastal cliff retreat for the State of California was -0.3±0.2 m/yr, based on rates averaged from 17,653 individual transects measured throughout all areas of California's rocky coastline. The average amount of cliff retreat was 17.7 m over the 70-year time period of our analysis.” A U.S. Geological Survey report on how far California's rocky coastal cliffs have retreated over time. The authors measured 17,653 transects, survey lines run across the coast, and found a statewide average retreat of 0.3 ± 0.2 metres a year. The article uses this measured rate for California, and sets Fleming's east-coast estimate of a metre a year beside it. ↩
- 25.
Fleming, Monte. “Evidence from Geology that Earth is Young.” Repository of Meaning (YouTube). Jul 21, 2023. At 01:05–01:14. At 00:28: The Pacific figure is given at this point: “about 20 centimeters per year”. A 17-minute YouTube lecture by Monte Fleming arguing from geology that the Earth is young. The article quotes it for the coastal erosion rate Fleming gives for the North American east coast, and for the Google search he says he took that figure from. ↩
- 26.
Fleming, Monte. “Coastal Erosion: How Old is the Earth?” Repository of Meaning (YouTube). Oct 17, 2022. “21 centimeters or 8 inches per year”. which matches the book's figure as reported by Woodmorappe. A 3-minute YouTube video by Monte Fleming on how old the Earth is, judged from coastal erosion. The article uses it for Fleming's coastline calculation. The same video gives the Pacific coast as. ↩
- 26a.
His east-coast average shelf width of 131.8 km and the two derived ages of 105,440 and 105,158.7 years are given on screen; the west-coast shelf width needed to produce his second figure is about 22 km. ↩
- 26a.
- 27.
Hapke, Cheryl J. et al. “National Assessment of Shoreline Change Part 3: Historical Shoreline Change and Associated Coastal Land Loss Along Sandy Shorelines of the California Coast.” USGS Open-File Report 2006-1219. 2006. “The average net rate of long-term shoreline change for California was 0.2 m/yr, an accretional trend. This is based on shoreline change rates averaged from 14,562 individual transects, of which 40% were eroding.” “When the erosion versus accretion rates were separated out, the average long-term erosion rate for the state was found to be –0.2 m/yr.” A US Geological Survey report on how California's sandy shorelines have moved over the long term, averaged over 14,562 transects (measured lines run across the shore). It covers sandy shoreline only. The companion Part 4 report, which covers cliffs, is cited elsewhere in the article. The article uses it to test Fleming's 20 cm/yr Pacific figure, which matches the report's erosion-only average. ↩
- 28.
Lambeck, Kurt et al. “Sea level and global ice volumes from the Last Glacial Maximum to the Holocene.” PNAS 111(43):15296–15303. Oct 13, 2014. Section Abstract: “a slow fall to -134 m from 29 to 21 ka BP”. “a progressive decrease in the rate of rise from 8.2 ka to ∼2.5 ka BP, after which ocean volumes remained nearly constant until the renewed sea-level rise at 100-150 y ago.” A research paper that rebuilds past sea level by inverting about 1,000 observations from places far from the former ice sheets, covering the past 35,000 years. Its abstract reports a slow fall to 134 m below present from 29 to 21 ka BP (thousands of years before present). The article uses that figure to show how far the shoreline moved in the last ice age. ↩
- 29.
Hurst, Martin D. et al. “Recent acceleration in coastal cliff retreat rates on the south coast of Great Britain.” PNAS 113(47):13336–13341. 2016. “The 10Be concentrations are consistent with retreat rates of chalk cliffs that were relatively slow (2-6 cm·y−1) until a few hundred years ago. Historical observations reveal that retreat rates have subsequently accelerated by an order of magnitude (22-32 cm·y−1).” Their explanation: “We suggest that acceleration is the result of thinning of cliff-front beaches, exacerbated by regional storminess and anthropogenic modification of the coast.” A research paper on chalk cliffs on the south coast of Great Britain. It uses beryllium-10, a rare isotope that builds up in exposed rock, to estimate past retreat rates, and compares them with observed rates. It finds slow retreat until a few hundred years ago, then a tenfold acceleration. The article uses it as the clearest case that historic rates overstate long-term ones. ↩
- 30.
Swirad, Zuzanna M. et al. “Cosmogenic exposure dating reveals limited long-term variability in erosion of a rocky coastline.” Nature Communications 11:3804. 2020. A research paper that uses cosmogenic exposure dating, a method that times how long rock has been exposed by measuring rare isotopes that build up in it, on a rocky coastline. Its title reports little variation in erosion over the long term. The article uses it to show that the historic acceleration is not universal, because on one Yorkshire coast retreat has stayed steady. ↩
- 31.
Luijendijk, Arjen et al. “The State of the World's Beaches.” Scientific Reports 8:6641. 2018. A study of the world's beaches, published in Scientific Reports. Its abstract says 28% of beaches are accreting, that is, gaining sand, but its results text says 27%, and Fleming quotes the abstract. The article uses it as the satellite study that Fleming criticises, and grades his objections to it. ↩
- 32.
Bossis, Rémi et al. “Evidence of slow millennial cliff retreat rates using cosmogenic nuclides in coastal colluvium.” Earth Surface Dynamics 13:71–79. 2025. The authors open by noting that. “there are no available methods that can be used to quantify slow coastal erosion (< 1 cm yr−1) averaged over millennia”. A research paper that measures cosmogenic nuclides, rare isotopes built up in rock, in coastal colluvium, the loose debris that slides off cliffs, to measure how slowly cliffs retreat over millennia. It analysed eleven samples, eight from the Mediterranean coast of the eastern Pyrenees and three from southern Peru. The article uses it as direct evidence that very slow cliff retreat happens. ↩
- 33.
Limber, Patrick W., and A. Brad Murray. “Beach and sea-cliff dynamics as a driver of long-term rocky coastline evolution and stability.” Geology 39(12):1147–1150. 2011. “Numerical experiments indicate that through such interactions, rocky coastlines can reach an equilibrium configuration where headlands and embayments remain stable through time, even in the absence of alongshore variations in sea-cliff lithology.” A modelling study, using numerical experiments run on a computer, of how beaches and sea cliffs shape a rocky coast over long periods. Its experiments show that a coast can settle into a stable pattern of headlands and bays with no variation in rock type along it. The article uses it to show that slow long-term retreat is physically expected, not merely convenient. ↩
- 34.
Payo, A. et al. “Feedback structure of cliff and shore platform morphodynamics.” Journal of Coastal Conservation 19:847–859. 2015. “The backwearing erosion rate (cliff horizontal erosion) has been found to be controlled by at least four feedback loops; three balancing (cliff toe wave energy depletion, ground-water pore pressure diminution and cliff deposit protection) and one positive loop (abrasion enhancement).” A paper on the feedback loops that control how fast sea cliffs and their rock platforms wear back. It identifies four loops in cliff backwearing: three balancing, self-limiting loops and one positive loop that speeds erosion up. The article uses it for the claim that three of these loops are self-limiting, which is part of why slow long-term retreat is physically expected. ↩
- 35.
Isaak, Mark. “CD501: Mountain erosion.” An Index to Creationist Claims, TalkOrigins Archive. 2003. A web entry in Mark Isaak's index of creationist claims, first written in 2003 and revised in 2004. The article uses it as the most-cited skeptical answer to the mountain-erosion argument, and points out that this answer contains no numbers. ↩
- 36.
Fischer, Peter. “The Age of the Earth — Erosion of Continents as a Creationist Clock.” University of South Dakota course pages. n.d. A web page from University of South Dakota course pages, on erosion of continents as a creationist clock. Its companion page is on Francis Redfern's PRISM physics-outreach site, and whether one is derived from the other could not be determined. The article uses the two pages together, as widely copied sources that put continental erosion at a rate ten times too small. ↩
- 37.
Portenga, Eric W., and Paul R. Bierman. “Understanding Earth's eroding surface with 10Be.” GSA Today 21(8):4–10. 2011. A compilation of 1,599 beryllium-10 erosion rates from 87 studies, each recalculated on one single scheme. Outcrops, which are exposed bedrock (450 samples), have a mean of 12 ± 1.3 m/Myr (metres per million years) and a median of 5.4 m/Myr, and no outcrop in the whole global set exceeds 140 m/Myr. Drainage basins (1,149 samples) have a mean of 218 ± 35 m/Myr and a median of 54 m/Myr. The article uses the basin figure, not the outcrop figure, as the relevant rate for a whole-continent sediment budget. ↩ ↩
- 37a.
Section Introduction, page 4: “Because soils are typically well-stirred by physical and biological processes, shallow, human-induced soil erosion does not typically affect cosmogenic estimates of basin-scale erosion rates.” Section Discussion: The authors describe the compilation as. “the first broad, standardized view of pre-human, geologic erosion rates.” ↩
- 37a.
- 38.
Reusser, Lucas et al. “Quantifying human impacts on rates of erosion and sediment transport at a landscape scale.” Geology 43(2):171–174. 2015. “These 10Be-based rates are indicative of the pace at which the North American passive-margin landscape eroded before European settlement (∼8 m/m.y.)” “rates of hillslope erosion (∼950 m/m.y.) exceeded 10Be-determined background rates more than one-hundred fold”. “large-basin sediment yields during peak disturbance increased 5–10× above pre-settlement norms”. “rivers at the time were transporting only ∼6% of the eroded material”. A study of ten southeastern US basins of 10,000–100,000 km² that uses beryllium-10 (10Be) rates to estimate the pace of erosion before European settlement. It finds that hillslope erosion ran far above that background, but river sediment yields rose only 5–10× because the rivers were carrying only about six per cent of the eroded material. The article uses it to show that the hundredfold increase is real but does not reach the rivers, so most of the eroded material is still on hillslopes and in valley floors. ↩ ↩
- 39.
Kirchner, James W. et al. “Mountain erosion over 10 yr, 10 k.y., and 10 m.y. time scales.” Geology 29(7):591–594. 2001. “These long-term sediment yields are, on average, 17 times higher than stream sediment fluxes measured over 10–84 yr, but are consistent with 10 m.y. erosion rates measured by apatite fission tracks.” “For our long-term and short-term measurements to be even approximately compatible with one another, 70%–97% of sediment delivery must occur during episodes that are too infrequent to be detected by conventional sediment-yield measurements.” A 2001 Geology paper by seven authors comparing mountain erosion measured over 10 years, 10,000 years and 10 million years. It finds that long-term sediment yields are on average 17 times higher than stream sediment measured over 10–84 years, and that 70%–97% of sediment delivery must happen in episodes too infrequent for conventional measurement. The article uses it for steep terrain, where thirty-two Idaho catchments gauged for decades by the Forest Service gave cosmogenic rates about seventeen times the gauged rates. ↩ ↩
- 40.
Sadler, Peter M., and Douglas J. Jerolmack. “Scaling laws for aggradation, denudation and progradation rates: the case for time-scale invariance at sediment sources and sinks.” Strata and Time: Probing the Gaps in Our Understanding 404:69–88. Geological Society, London. 2015. A chapter in a Geological Society volume that tests whether rates of sediment build-up and wear-down depend on the time span over which they are measured. The article uses it for the claim that upland denudation rates show little or no dependence on the measurement interval, and that the global sediment flux to the oceans has been roughly constant from months to tens of millions of years. ↩
- 41.
Wilner, J. A. et al. “Limits to timescale dependence in erosion rates: Quantifying glacial and fluvial erosion across timescales.” Science Advances 10(51):eadr2009. Dec 20, 2024. A 2024 research paper in Science Advances that examines whether glacial and river erosion rates depend on the timescale over which they are measured. The article uses it, with a compilation of about 6,400 measurements, to show that river erosion rates show no timescale dependence. ↩
- 42.
Hebert, Jake. “Five Global Evidences for a Young Earth.” Acts & Facts 48(7). Institute for Creation Research. Jun 28, 2019. An article in Acts & Facts, the periodical of the Institute for Creation Research, arguing from five lines of evidence that the Earth is young. The article uses it because Hebert cites a 1963 U.S. Geological Survey paper by Schumm in support of the erosion argument, and dismisses episodic uplift and isostatic compensation. ↩
- 43.
Thomas, Brian. “Continents Should Have Eroded Long Ago.” Institute for Creation Research. Aug 22, 2011. A web article on the Institute for Creation Research site arguing that the continents should have worn away long ago, with erosion rates drawn from a compilation of beryllium-10 measurements by Portenga and Bierman. The article uses it for one sentence that describes beryllium-10 as becoming radioactive from exposure to sunlight, which is wrong; the same article draws its rates correctly from Portenga and Bierman's compilation, so the error looks like a slip rather than a pattern. ↩
- 44.
Snelling, Andrew A., and Tom Vail. “When and How Did the Grand Canyon Form?” The New Answers Book 3, 175–187. Master Books. n.d. “It has been estimated that this volume of sediments eroded from the plateau was around 100,000 cubic miles (400,000 cubic km)!” The estimate is attributed to Vail, Oard, Hergenrather and Bokovoy, Your Guide to the Grand Canyon (2008), p. 54. The chapter gives the plateau area as. “about 250,000 square miles (647,000 square km).” 400,000 km³ ÷ 647,000 km² = 618 m. Chapter 18 of The New Answers Book 3, on when and how the Grand Canyon formed. The article uses it because its figure for the volume of rock eroded from the Colorado Plateau is sourced to another creationist book, not to a measurement. ↩
- 45.
Helble, Timothy K. “Sediment Transport and the Coconino Sandstone: A Reality Check on Flood Geology.” Perspectives on Science and Christian Faith 63(1):25–41. Mar 2011. A paper by Timothy Helble, a retired National Weather Service hydrologist and a co-editor of The Grand Canyon: Monument to an Ancient Earth, published in Perspectives on Science and Christian Faith, the quarterly of the American Scientific Affiliation, a Christian organisation whose membership carries no doctrinal precondition on origins. The article uses it because it is the only confessional journal among its sources that a mainstream index covers, and because its sediment-transport arithmetic tests the flood-geology account of the Coconino Sandstone. ↩
- 45a.
Helble quotes the 1994 statement and comments: “In this statement, the six authors appear to be conceding the Flood would not be able to erode enough pre-Flood rock to produce all the sediment needed to form all of the 'early' and 'late Flood' sedimentary rock layers.” ↩
- 45a.
- 46.
Whitmore, John H., and Paul A. Garner. “Helble's critique of creationist research on the Coconino Sandstone fails.” Proceedings of the 2025 New Scholars International Conference on Creationism, 32. Cedarville University, Cedarville, Ohio. Edited by J. H. Whitmore. 2025. An oral presentation at the 2025 New Scholars International Conference on Creationism, which publishes abstracts only, in a volume that John Whitmore edited and for which he wrote the preface. The article uses it for a concession: Helble is right that the processes he outlines could not have formed the Coconino during the Flood, but the Flood model needs extrapolations beyond present-day conditions. ↩
- 47.
Thigpen et al. “Metamorphic pressures for the western and central Blue Ridge, southern Appalachians.” Tectonics. 2022. Pressure is converted to depth as z = P/(ρg) with ρ = 2,750 kg/m³ and g = 9.81 m/s², giving 3.71 km per kilobar: 5.8 kbar → 21.5 km, 8.9 kbar → 33.0 km, 11.5 kbar → 42.6 km. On error bars: barometric uncertainties are typically ±1-2 kbar, which is ±4-7 km, large in absolute terms and far smaller than the quantity being demonstrated. A summary of metamorphic pressures, the depths at which rocks were buried, taken from the thermobarometric literature, which estimates the pressure a rock formed under from the minerals in it. It draws on Thigpen et al. (2022) and on Anderson and Moecher (2009), doi:10.1029/2008TC002319, also in Tectonics. The article uses these pressures for the southern Appalachians, because that is the range Morton used against DeVilbiss. ↩
- 48.
Bierman, Paul R., and Marc Caffee. “Cosmogenic exposure and erosion history of Australian bedrock landforms.” GSA Bulletin 114(7):787–803. 2002. “Exceptionally high activities of in situ–produced 10Be and 26Al indicate that Australian bedrock surfaces are some of the most stable in the world.” “nuclide activities are not saturated in any of the 61 exposed samples we analyzed, mandating that the surfaces we sampled are losing mass, albeit slowly, over time.” A study of the cosmogenic nuclides beryllium-10 and aluminium-26 in sixty-one samples from ten sites on a transect from the Eyre Peninsula to Kakadu. Its authors say Australian bedrock surfaces are among the most stable in the world, and that the samples show the surfaces are still losing mass, albeit slowly. The article uses it for the point that these landforms are old in form while being continuously lowered. ↩ ↩
- 49.
Bierman, Paul R., and Marc Caffee. “Slow Rates of Rock Surface Erosion and Sediment Production across the Namib Desert and Escarpment, Southern Africa.” American Journal of Science 301(4–5):326–358. 2001. A field study of how slowly bare rock surfaces in the Namib Desert and its escarpment wear away. The authors measured two rare isotopes, beryllium-10 and aluminium-26, which build up in rock exposed to cosmic rays, in sixty-six paired analyses. Bedrock averages 3.2 ± 1.5 m/Myr inland of the escarpment and 3.6 ± 1.9 m/Myr seaward. The article uses it for the very slow erosion of the oldest and quietest surfaces. ↩
- 50.
Pederson, Joel L. et al. “Colorado Plateau uplift and erosion evaluated using GIS.” GSA Today 12(8):4–10. 2002. Section Early Cenozoic Rock Uplift: “The Paleozoic and Mesozoic sedimentary sections of the Colorado Plateau contribute ~3 km to its 40–45-km-thick crust.” A mapping study that uses a geographic information system, a computer program that combines maps and elevation data, to measure how much rock the Colorado Plateau has been uplifted and eroded. Its abstract reports 2,117 m of mean rock uplift and 406 m of net erosion since the Late Cretaceous, and 843 m of erosion since about 30 Ma (million years ago). The article uses it for how much rock a craton, a stable old block of continental crust, has lost: the plateau's Paleozoic and Mesozoic rock is about 3 km thick, and it has shed only four to eight hundred metres through the Cenozoic. ↩
- 51.
Flowers, Rebecca M. et al. “Unroofing, incision, and uplift history of the southwestern Colorado Plateau from apatite (U-Th)/He thermochronometry.” GSA Bulletin 120(5–6):571–587. 2008. A research paper that uses apatite (U-Th)/He thermochronometry, a method that times when a rock cooled as erosion brought it nearer the surface, to reconstruct how the southwestern Colorado Plateau was unroofed (stripped of the rock above it), incised and uplifted. The article uses it as independent confirmation that the plateau's quiet places really were quiet, from a study with no stake in the argument. ↩
- 52.
Willenbring, J. K. et al. “Earth is (mostly) flat, but mountains dominate global denudation: apportionment of the continental mass flux over millennial time scales, revisited.” Earth Surface Dynamics Discussions 2:1–17. 2014. “we find that the denudation flux from the steepest 10 % of continental topography nearly equals the flux from the other 90 % of the continental surface combined. This new analysis implies global denudation fluxes of ∼ 23 Gt yr−1, roughly five times the value reported in Willenbring et al. (2013).” A revised estimate of how much rock the continents lose each year, by Willenbring and four co-authors, correcting their own 2013 paper in Geology 41(3):343–346. The words below are the paper's own statement of that correction. The article uses it for the finding that the steepest ten per cent of the continental surface supplies close to half of all global denudation. ↩
- 53.
Granger, Darryl E. et al. “Spatially Averaged Long-Term Erosion Rates Measured from in Situ-Produced Cosmogenic Nuclides in Alluvial Sediment.” The Journal of Geology 104(3):249–257. 1996. “These two independent estimates agree within one standard error, demonstrating that cosmogenic nuclide signatures of stream sediment can be used to measure spatially averaged long-term erosion rates.” A paper on measuring long-term erosion from cosmogenic nuclides, which are rare isotopes that cosmic rays make in exposed rock and that the river sediment carries. It finds that two independent estimates of erosion agree within one standard error. The article uses it as the first test of the cosmogenic clock, against sediment piled up in alluvial fans over sixteen thousand years. ↩
- 54.
Oard, Michael J. “Creation in-depth: Erosion and the post-Flood boundary.” Journal of Creation 27(2):62–70. Aug 2013. A journal article by Michael Oard, one of four parts that answer the regional-unconformity objection by assigning continental-scale erosion to the receding phase of the Flood. The figure of 0.275 m of average continental erosion in 4,500 years at present rates appears in those four parts. The article uses it to show that the young-earth response to this dataset is not silence: Oard addresses cosmogenic methods and rules them out before looking at them. ↩
- 55.
Twidale, C. R. “On the Survival of Paleoforms.” American Journal of Science 276(1):77–95. 1976. Section Models of Landscape Evolution, page 81: The quotation is from the opening of this section. A paper in the American Journal of Science on paleoforms, old landforms that are still preserved in today's landscape. Roth reviewed this paper in Origins 3(2):106 (1976) and returned to it in his 1986 and 1988 papers. The article uses it because the author calls the survival of these landforms an embarrassment to standard models of landscape change, and then explains which survivals pose no problem. ↩
- 56.
Flowers, Rebecca M. et al. “Low long-term erosion rates and extreme continental stability documented by ancient (U-Th)/He dates.” Geology 34(11):925–928. 2006. A research paper in Geology that uses (U-Th)/He dates, which date minerals by the helium that uranium and thorium have produced inside them, to show how slowly the land has been worn down. Fleming cites it as footnote 12 of his Chapter 2, and the article checks his reading against what the authors say. ↩
- 57.
England, Philip, and Peter Molnar. “Surface uplift, uplift of rocks, and exhumation of rocks.” Geology 18(12):1173–1177. 1990. Section abstract. A 1990 paper in Geology that separates two things often confused: the ground at the surface rising, and rocks being brought up toward the surface as the material above them is eroded away. The article uses it for that distinction, which means a reported rise in a mountain range is not necessarily a rise of its surface. ↩
- 58.
Stevens, V. L., and J.-P. Avouac. “Interseismic coupling on the main Himalayan thrust.” Geophysical Research Letters 42(14):5828–5837. 2015. “From the general agreement between geodetic and geological rates, we find the fraction of anelastic deformation is up to 10% at the 70% confidence level.” A 2015 research letter that combines GPS, radar (InSAR) and small-earthquake data along the whole Himalayan arc to measure how the fault under the range is locked and how fast it slips. Its authors work at the California Institute of Technology and the University of Cambridge. The abstract says the geodetic and geological rates agree, which means the strain is essentially elastic (it is released in earthquakes) and only a small percentage is permanent. The article uses it to show that the permanent share of Himalayan deformation has been measured, and is small. ↩
- 59.
Dadson, Simon J. et al. “Links between erosion, runoff variability and seismicity in the Taiwan orogen.” Nature 426(6967):648–651. 2003. A Nature paper by a twelve-author team that links erosion in the Taiwan orogen, its mountain belt, to variable runoff and to earthquakes. The article uses it for the Taiwan figure: erosion runs at three to six millimetres a year on every timescale from decades to millions of years. ↩
- 60.
Einsele, Gerhard et al. “The Himalaya-Bengal Fan denudation-accumulation system during the past 20 Ma.” The Journal of Geology 104(2):163–184. 1996. A study that balances the rock eroded off the Himalaya over the past 20 million years against the sediment that accumulated in the Bengal Fan, a huge undersea deposit of river sediment. About 0.6 million km³ of the accumulated total is attributed to sources other than the Himalaya, and that share is already inside the twenty-per-cent agreement the article reports. The article uses it as a case where the rock eroded from the mountains has been found in the sediment, in about the right amount. ↩
- 61.
Han, Xu et al. “Recent uplift of Chomolungma enhanced by river drainage piracy.” Nature Geoscience 17:1031–1037. 2024. A 2024 study in Nature Geoscience arguing that a river capture, in which one river takes over the drainage of another (called drainage piracy in the title), has sped up the recent uplift of Chomolungma, the Tibetan name for Mount Everest. The capture is dated to a best fit of about 89,000 years ago, with well-fitting models spanning 50,000 to 100,000 years, matched against independent optically stimulated luminescence ages (a method that dates when sediment was last exposed to daylight) of 30,000 to 90,000 years on upstream sediments. The authors state their isostatic figures (the crust rising as erosion removes weight) are minimum estimates because hillslope erosion is not modelled. The article uses it for the question of whether the mountain is rising faster now than its long-term rate. ↩
- 62.
Snelling, Andrew A. “The 10 Best Evidences from Science That Confirm a Young Earth.” Answers magazine, Answers in Genesis. 2012. A popular article listing ten pieces of supposed scientific evidence for a young earth, with the seafloor-sediment argument listed first. The article uses it as Answers in Genesis's single strongest young-earth evidence, because Snelling lists this argument first. ↩
- 63.
Seton, M. et al. “A Global Data Set of Present-Day Oceanic Crustal Age and Seafloor Spreading Parameters.” Geochemistry, Geophysics, Geosystems 21(10):e2020GC009214. 2020. Section Abstract: “We find the mean age of oceanic crust is 64.2 Myr, slightly older than previous estimates, mainly due to the inclusion of pockets of Mesozoic aged crust in the Atlantic and Mediterranean and improvements to the Jurassic Pacific triangle.” The grids are freely downloadable. A research paper that maps the age of the ocean floor from the magnetic anomaly identifications, the stripes of magnetism recorded in the seafloor, and a plate-motion model, and releases the grids as free data. It finds a mean age of oceanic crust of 64.2 million years. The article uses this average to show that the ocean floor is not as old as the ocean. ↩
- 64.
Baker, Jonathan. “'Best evidences' for a young Earth: Snelling and the ocean-sediment flux.” Age of Rocks. May 30, 2014. A blog post by Jonathan Baker, a Reformed Protestant geoscientist, that answers the ocean-sediment argument of Andrew Snelling. It is worth reading for its numbers rather than its tone, which is sharper than this article's. The article uses it for Baker's point that the argument's "average ocean sediment thickness" is a deep-ocean figure. ↩
- 65.
Hay, William W. et al. “Mass/age distribution and composition of sediments on the ocean floor and the global rate of sediment subduction.” Journal of Geophysical Research 93(B12):14933–14940. 1988. The subduction flux comes from von Huene, Roland and Scholl, David W., "Observations at convergent margins concerning sediment subduction, subduction erosion, and the growth of continental crust," Reviews of Geophysics 29(3):279-316 (1991). Three removal rates appear in the literature, and the article uses two of them: von Huene and Scholl's modern rate of 1.5 km³ a year (4.05 Gt a year at 2.7 t/m³), and Hay et al.'s own stated minimum of 1.0 Gt a year. Von Huene and Scholl's long-term average of about 1.0 km³ a year (2.7 Gt a year) sits between the two and gives 97 Myr. The article's sediment mass comes from Hay et al., and it checks the mass balance against the 64.2-million-year mean seafloor age from Seton et al. (2020). ↩
- 66.
Blakey, Ronald C. “Schnebly Hill Formation pages.” Northern Arizona University. n.d. A university teaching page by Ronald Blakey, the stratigrapher who mapped the unit, so it is not a peer-reviewed paper; the peer-reviewed papers behind it are Blakey 1990 in GSA Bulletin 102(9):1189–1217 and Blakey & Knepp 1989 in Geologic Evolution of Arizona, Arizona Geological Society Digest 17. It places the Schnebly Hill in the middle Leonardian (Early Permian), between the Hermit below and the Coconino above in the Sedona and Mogollon Rim area, thinning to a zero edge in the western Mogollon Rim and in the subsurface east of Grand Canyon, with no equivalent in the canyon itself. The article uses it for the gradational, intertonguing contact with the Coconino, which means the base of the Coconino is not the same age everywhere. ↩
- 67.
Whitmore, John H. “Coconino Sandstone research.” Answers Research Journal. n.d. Research on the Coconino Sandstone by John Whitmore, published in the Answers Research Journal. The article uses it for one clause in which Whitmore concedes that the missing time exists only if the top of the Hermit is isochronous, meaning of one age everywhere. ↩
- 68.
National Park Service. Grand Canyon geology pages. n.d. A summary page on Grand Canyon geology from the National Park Service, not a stratigraphic study. The article uses it for the description of Permian deposition in the canyon as nearly continuous, set against a six-million-year figure that has no primary source. ↩
- 69.
Nelstead, Kevin. “Six bad arguments from Answers in Genesis (Part 5) — unconformities.” The GeoChristian. Aug 9, 2009. A post by Kevin Nelstead, a geologist and a former young-earth creationist, criticising Answers in Genesis's arguments on unconformities. Its erosional relief on the Esplanade Sandstone comes from USGS Geologic Investigations Series I-2688, the 240 m of Precambrian relief is attributed to Hill and Moshier, and its Surprise Canyon Formation figure comes from the author's 2016 review of The Grand Canyon: Monument to an Ancient Earth. The article uses it for the exposed surfaces in the Grand Canyon, where the Redwall palaeokarst, the Surprise Canyon channels and the Precambrian relief show what long exposure leaves behind. ↩
- 70.
Whitmore, John H., and Raymond Strom. “Sand injectites at the base of the Coconino Sandstone, Grand Canyon, Arizona (USA).” Sedimentary Geology 230(1-2):46–59. 2010. Whitmore is a young-earth creationist who teaches at Cedarville University. This paper is in a mainstream Elsevier journal and reports original field data from thirty locations under Grand Canyon research permit GRCA-2005-SCI-0011. The article uses it as original creationist fieldwork on the injectite question, and grants that its case for injectites rather than desiccation cracks is strong. Mirror: Isgenesishistory.com ↩
- 70a.
Their two proposed resolutions, given in the same passage, are. “removal of the basal Coconino cement just prior to Laramide faulting; or sufficient and previously unknown movement of the Bright Angel Fault shortly after deposition of the basal Coconino”. ↩
- 70a.
- 71.
Sadler, Peter M. “Sediment Accumulation Rates and the Completeness of Stratigraphic Sections.” The Journal of Geology 89(5):569–584. 1981. “A compilation of nearly 25,000 rates of sediment accumulation shows that they are extremely variable, spanning at least 11 orders of magnitude.” “Expected completeness deteriorates as finer time scales are considered.” A compilation of nearly 25,000 measured rates of sediment accumulation, used to test how completely sections of the rock record preserve time. The article uses it for the finding that the rates vary over at least eleven orders of magnitude, and for the point that sediment builds up in bursts separated by long periods of nothing. ↩
- 72.
Sadler, Peter M. “The Influence of Hiatuses on Sediment Accumulation Rates.” GeoResearch Forum 5:15–40. 1999. A paper on how gaps in the rock record, called hiatuses, change measured sediment accumulation rates. Across the Milankovitch band, carbonate-platform accumulation rates fall to 10-20% of their shorter-term values, and Sadler concludes that the bedding-plane hiatuses bounding metre-scale cyclothems record 80-90% of the time in each accommodation cycle. The article uses that conclusion to argue that the time is in the surfaces between the layers, not in the rock. ↩
- 73.
Paola, Chris et al. “Time Not Our Time: Physical Controls on the Preservation and Measurement of Geologic Time.” Annual Review of Earth and Planetary Sciences 46:409–438. 2018. “the temporal completeness is, at most, 2 × 10⁻⁶,”. “whatever time gaps are hidden in conformable strata, at any scale, must mainly represent stasis.” A review by Chris Paola and four co-authors on how much geologic time survives in the rock record. Its worked example gives a temporal completeness of at most 2 × 10⁻⁶. The article uses it for the concession that the rock record is mostly absence of record, and for the review's rejection of the reading that the preserved beds were laid down by rare mega-events. Mirror: Www2.tulane.edu ↩ ↩
- 74.
Tipper, John C. “The importance of doing nothing: stasis in sedimentation systems and its stratigraphic effects.” Strata and Time 404:105–122. Geological Society, London. 2015. “The stratigraphic succession finally left behind by a system is necessarily a systematically biased and partial record of the history of that system.” A chapter on stasis, the periods when a sedimentary system is doing nothing, and how those periods show up in the rock record. The article uses it for Tipper's admission that the proportion of stasis cannot be reliably recovered from the strata a system leaves behind. ↩
- 75.
Mitchell, Tommy. “Arguments Christians Shouldn't Use.” Answers in Genesis. Jul 27, 2010. A web article by Dr. Tommy Mitchell of Answers in Genesis arguing that some arguments for creation are wrong even when the conclusion they support is right. The topic index it heads lists twenty-one retired arguments, from blood types on the Ark to Darwin's supposed deathbed conversion. No erosion, sediment, ocean-salt, delta or Niagara argument appears on it, and none appears on Creation Ministries International's equivalent list either. The article uses it for the call to hold creationist claims to the same high standards of peer review that creationists would demand of evolutionists. ↩